Summary
I advocate for planning symmetry in my WLAN designs and avoid, whenever possible, creating an unbalanced relationship between transmitters and receivers regarding their radio capabilities.
Following the deployment of a new wireless network in a large public venue, it was recognised during validation and by the end client that when conducting speed tests at various locations within the main arena bowl, the uplink performance was sometimes noticeably better than the downlink, even when the building was empty.
When observing the associated metrics that could affect these throughput values (SNR, RSSI, MCS) from both a STA and the AP, both should have been able to support similar bi-directional throughput.
Test Configuration
To investigate this, I isolated a single AP and performed back-to-back testing with different mobile devices to ascertain the root cause. This wasn’t an exhaustive list, as this behaviour seemed to be replicated on any device.
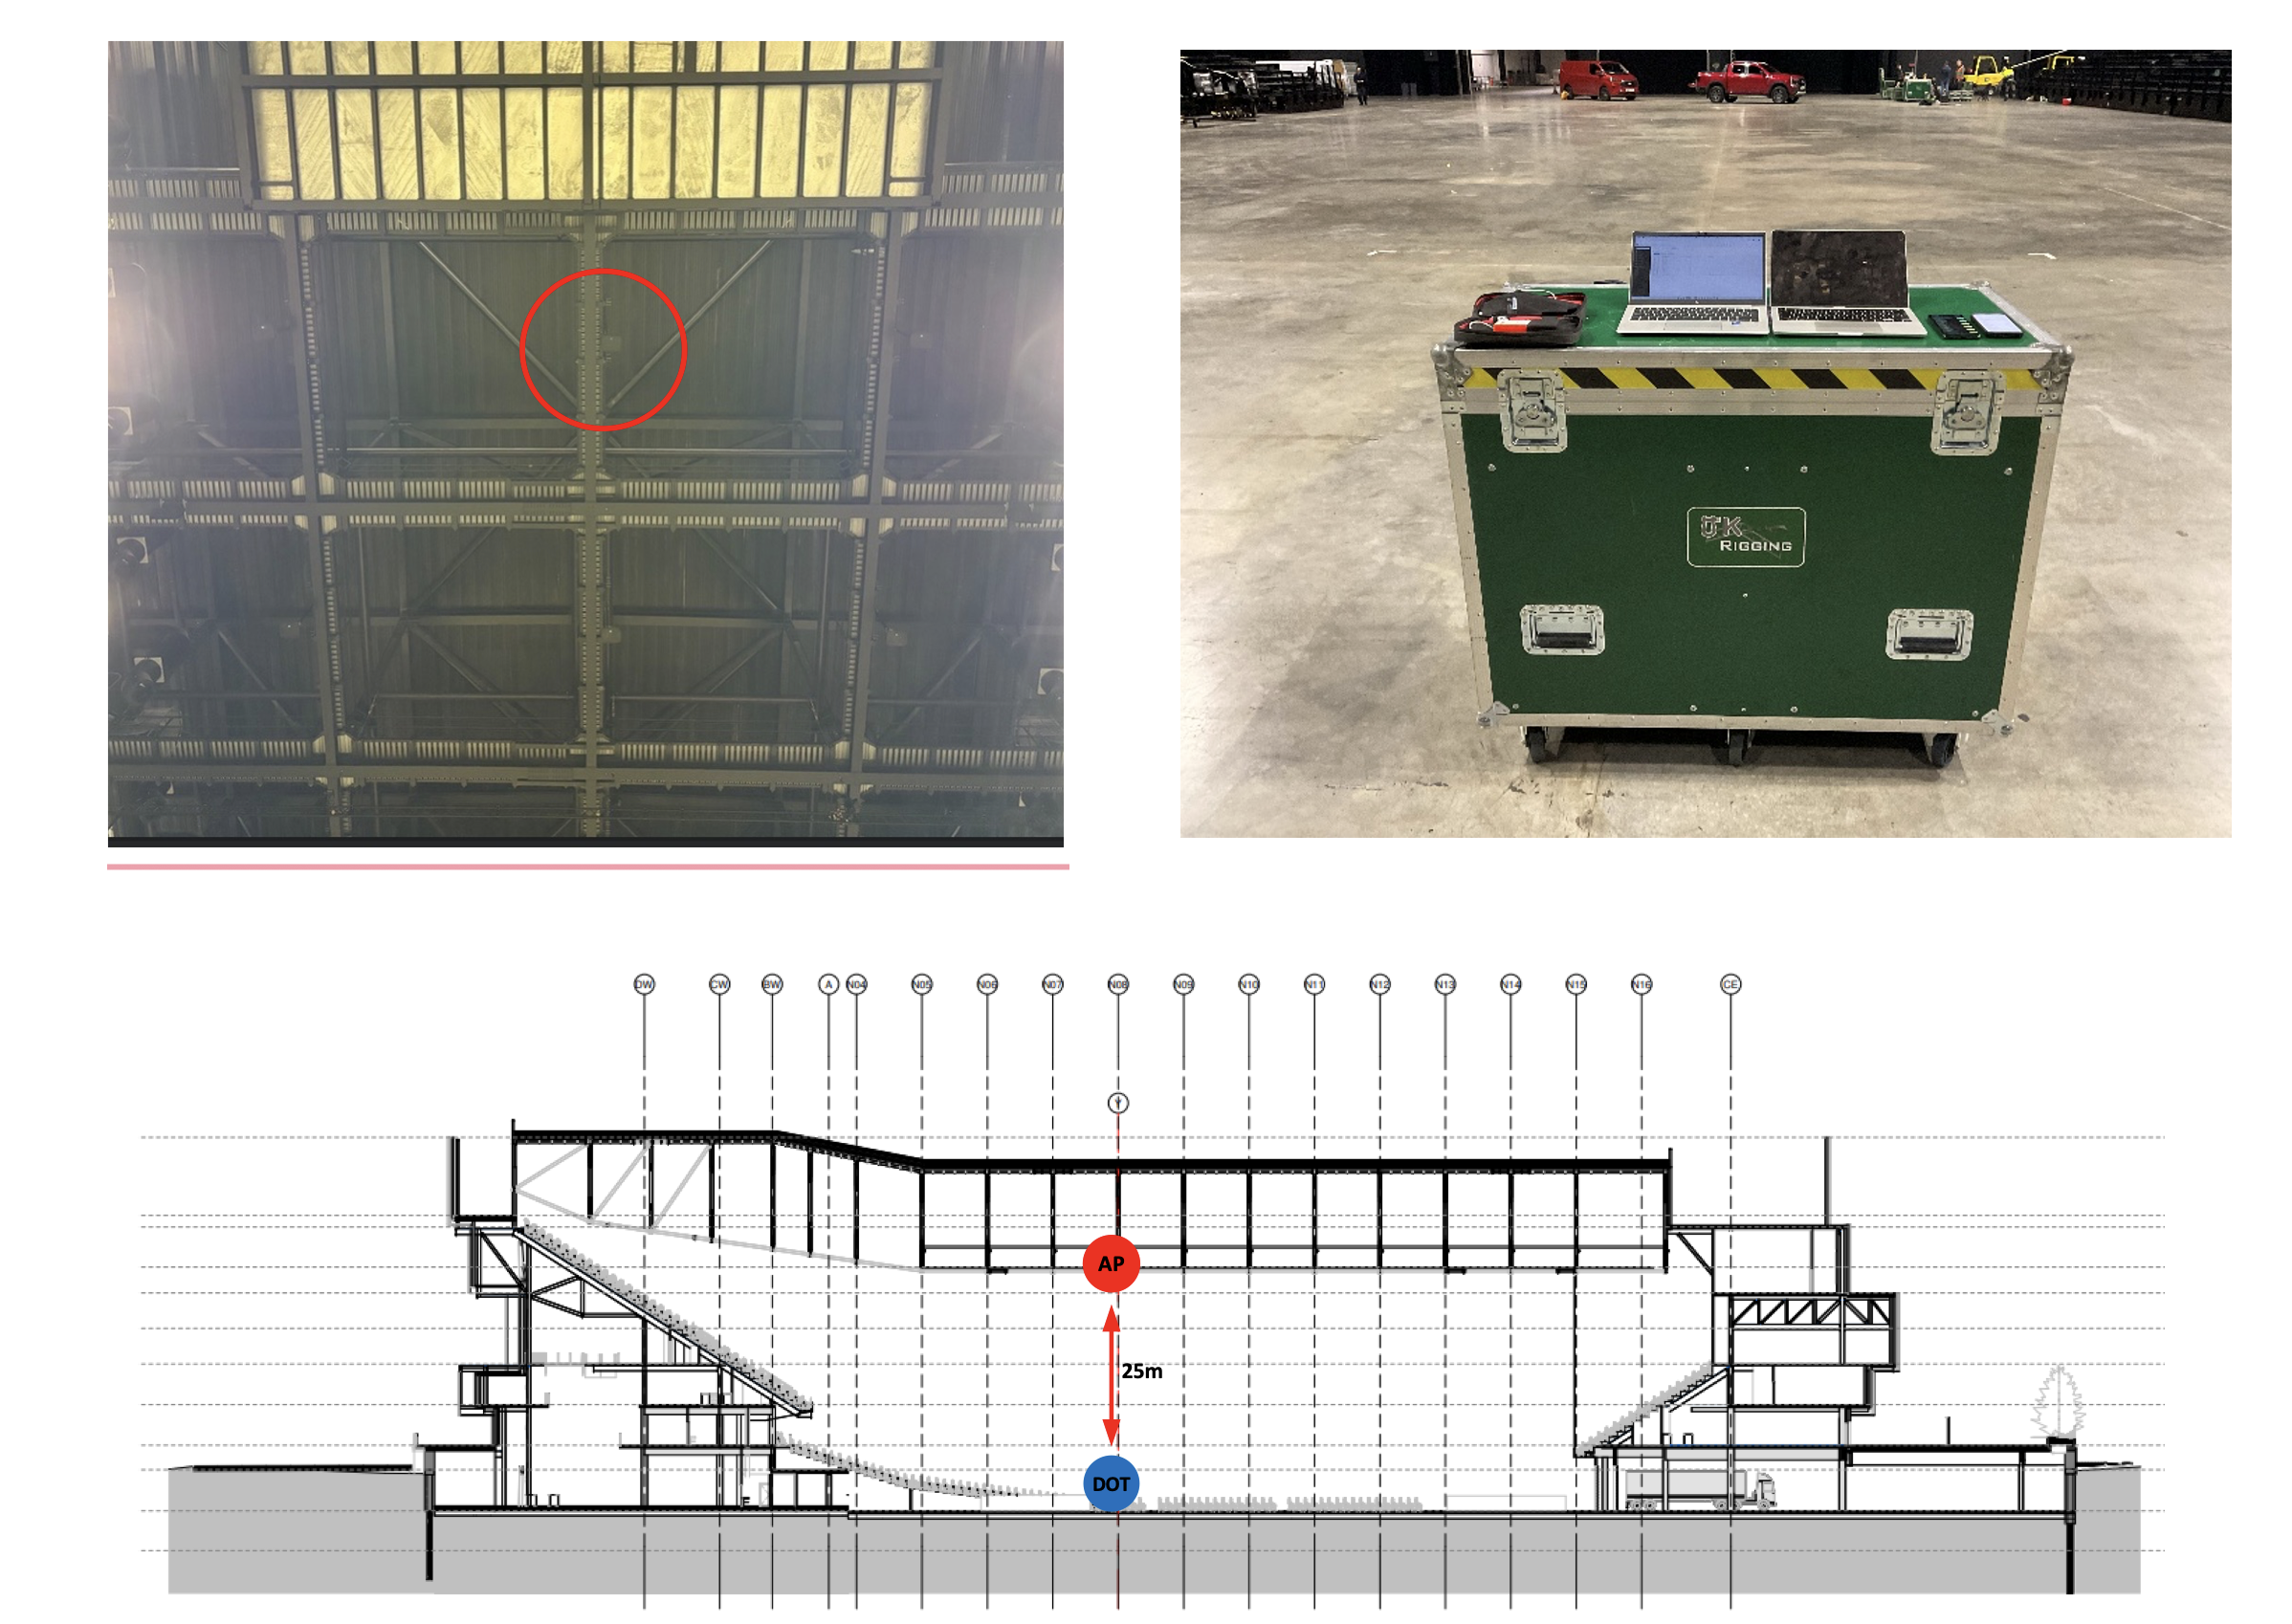
The AP test is 25m from the client device, pointing directly towards the floor, and conducted when the bowl was empty, i.e., minimal contention.
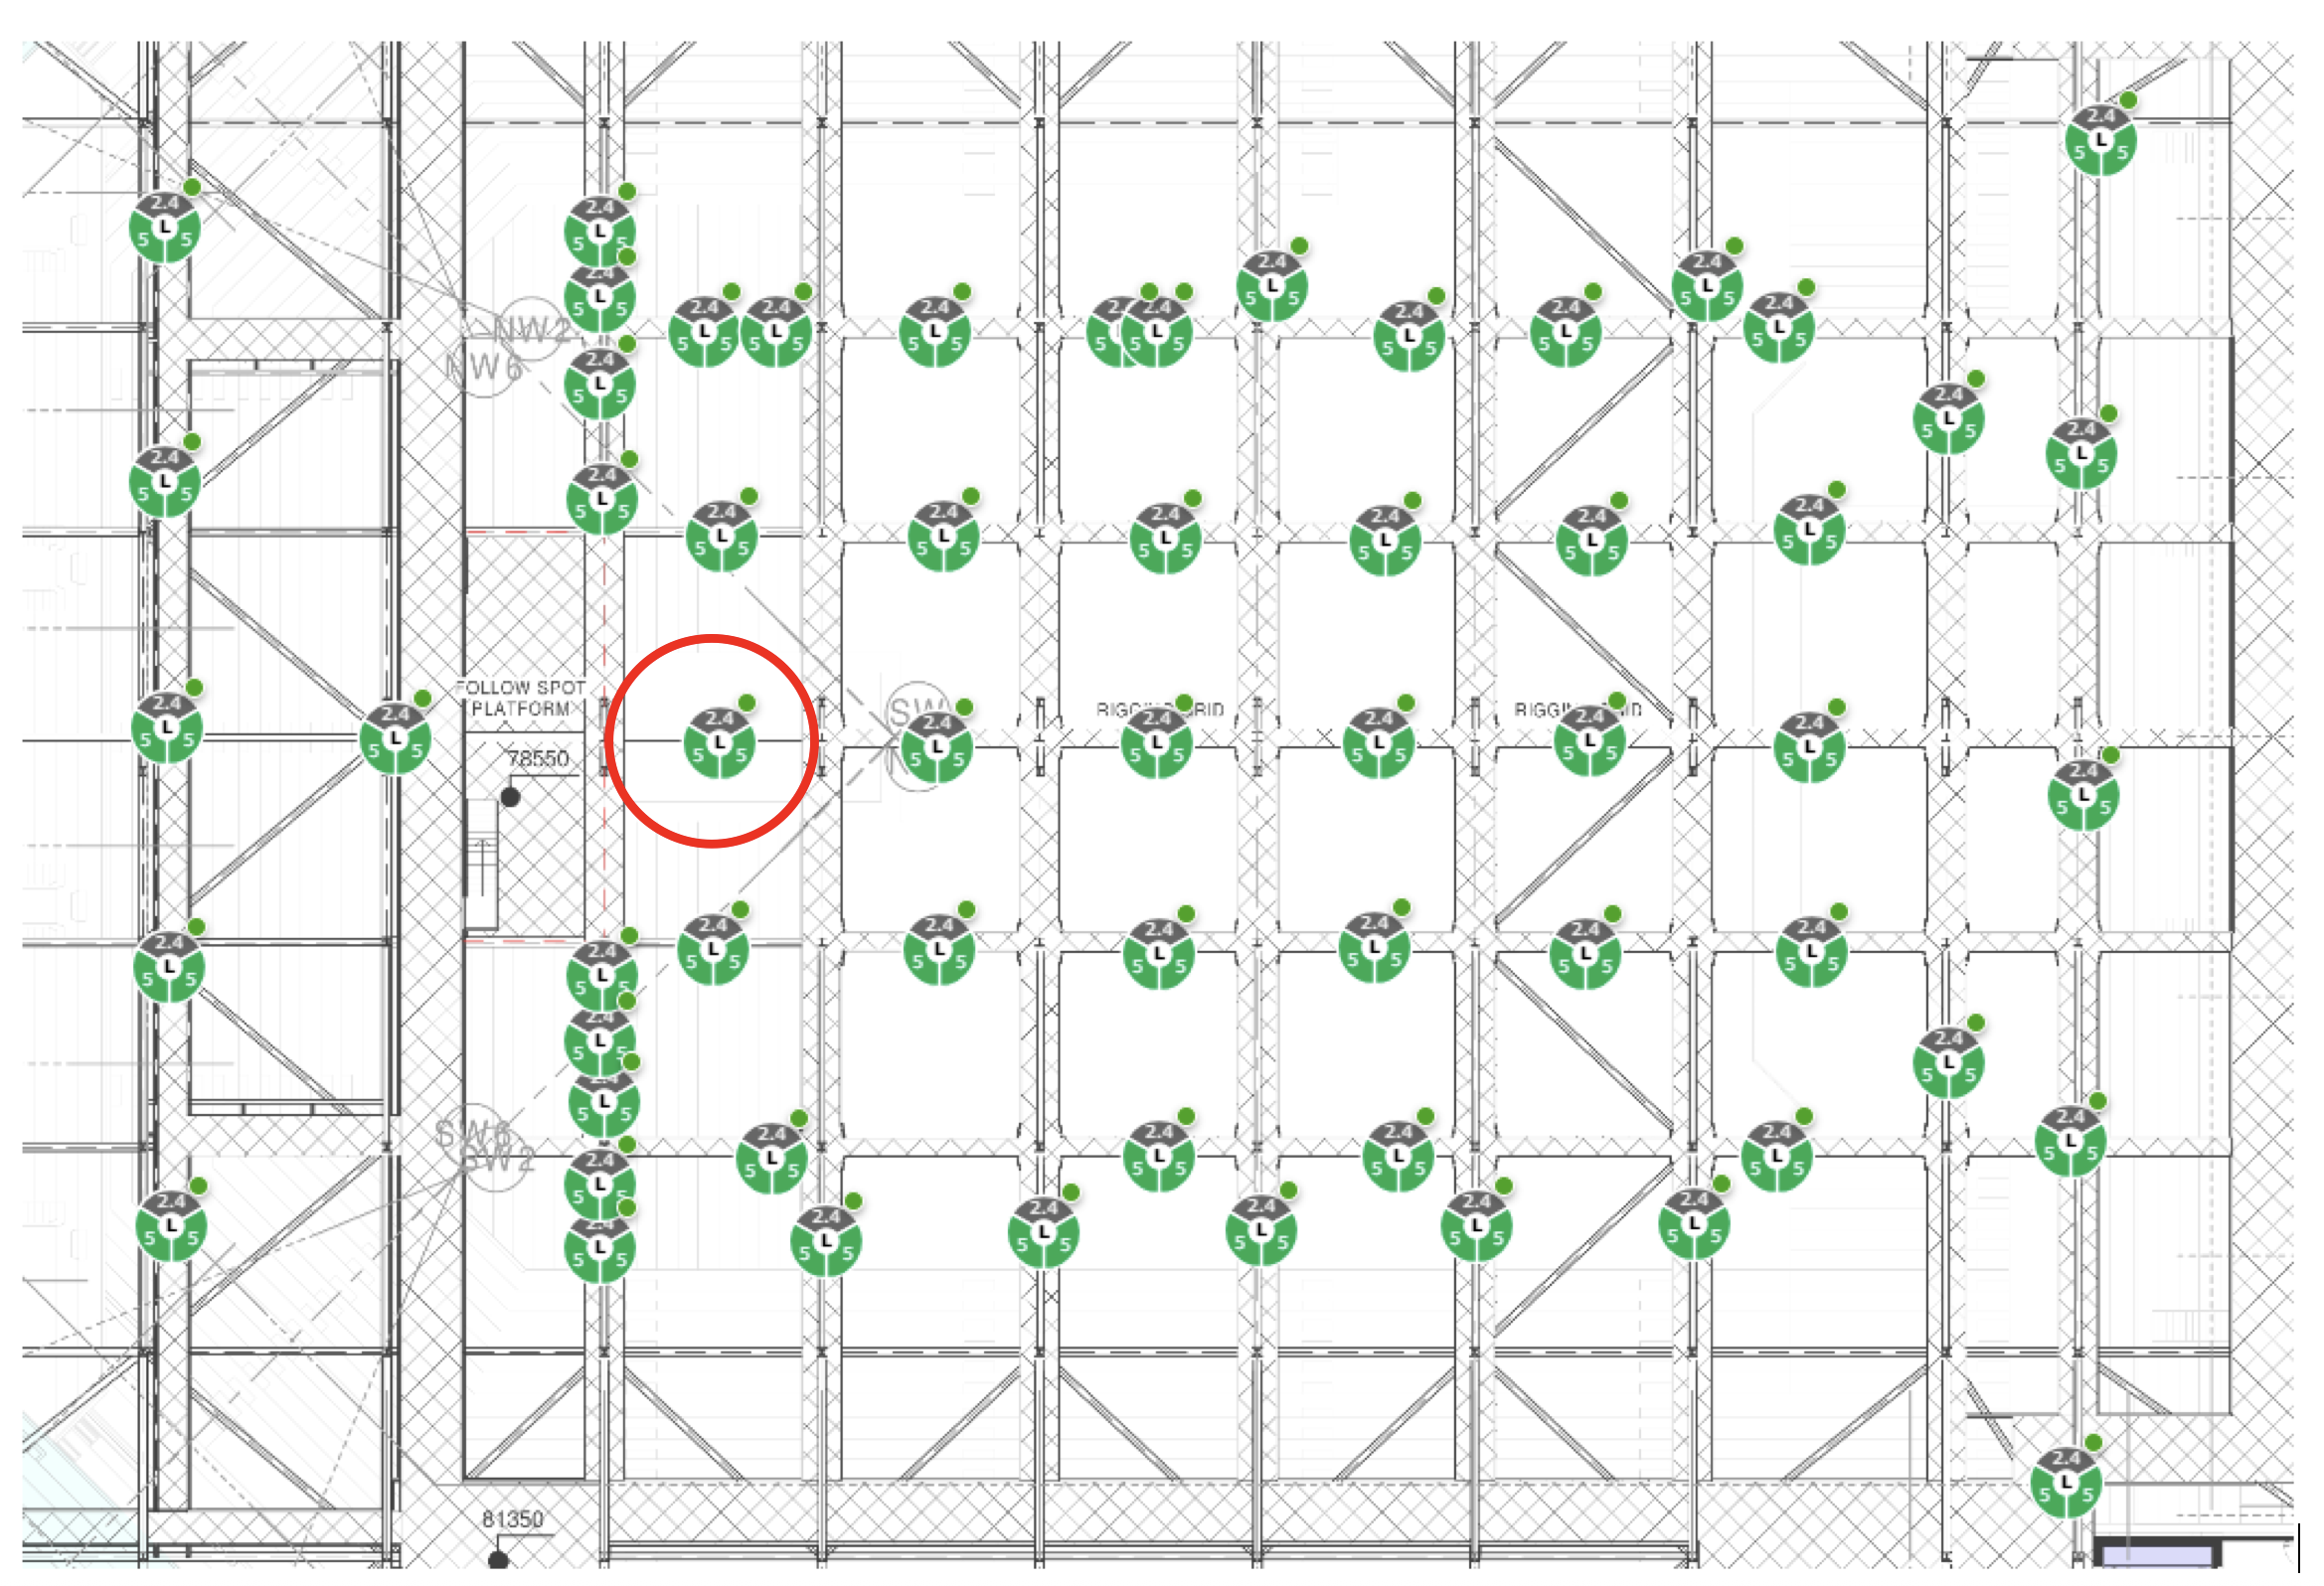
Figure 1 – Bowl Overhead AP Layout
All test devices were positioned directly under the AP, remained in a fixed position, and consisted of the following:
- Apple iPhone 16
- Samsung A52s
- Apple MacBook Pro
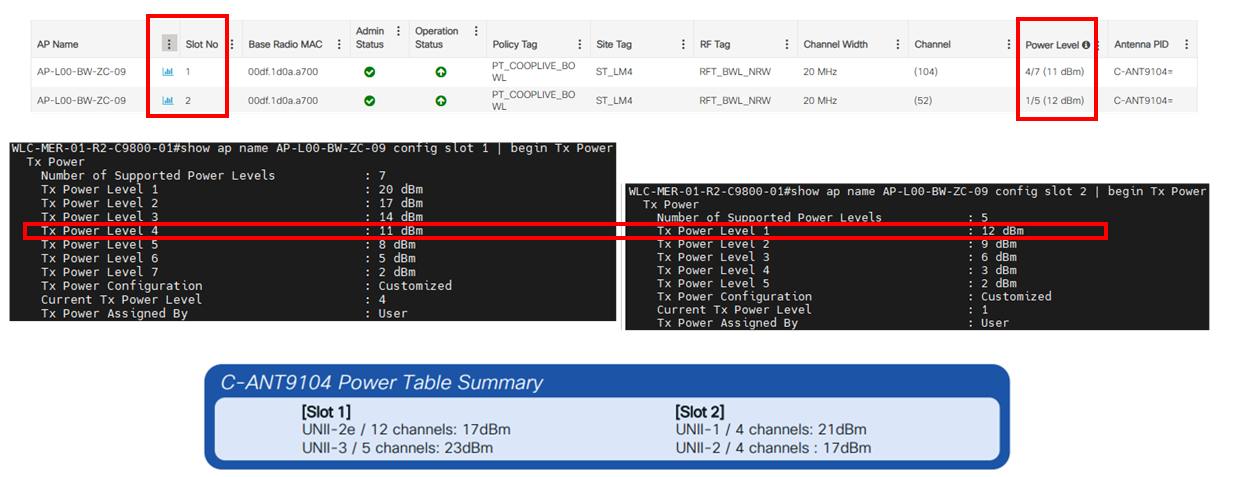
To prevent clients from roaming during the test, one SSID (Vanilla SSID Slot1) was broadcast, attached to a single 5 GHz radio, and independent of any production SSID. The SSID was left open with no authentication or encryption. This was a dual 5GHz design for the record, hence the need to isolate a single slot.
Device Capability Assessment
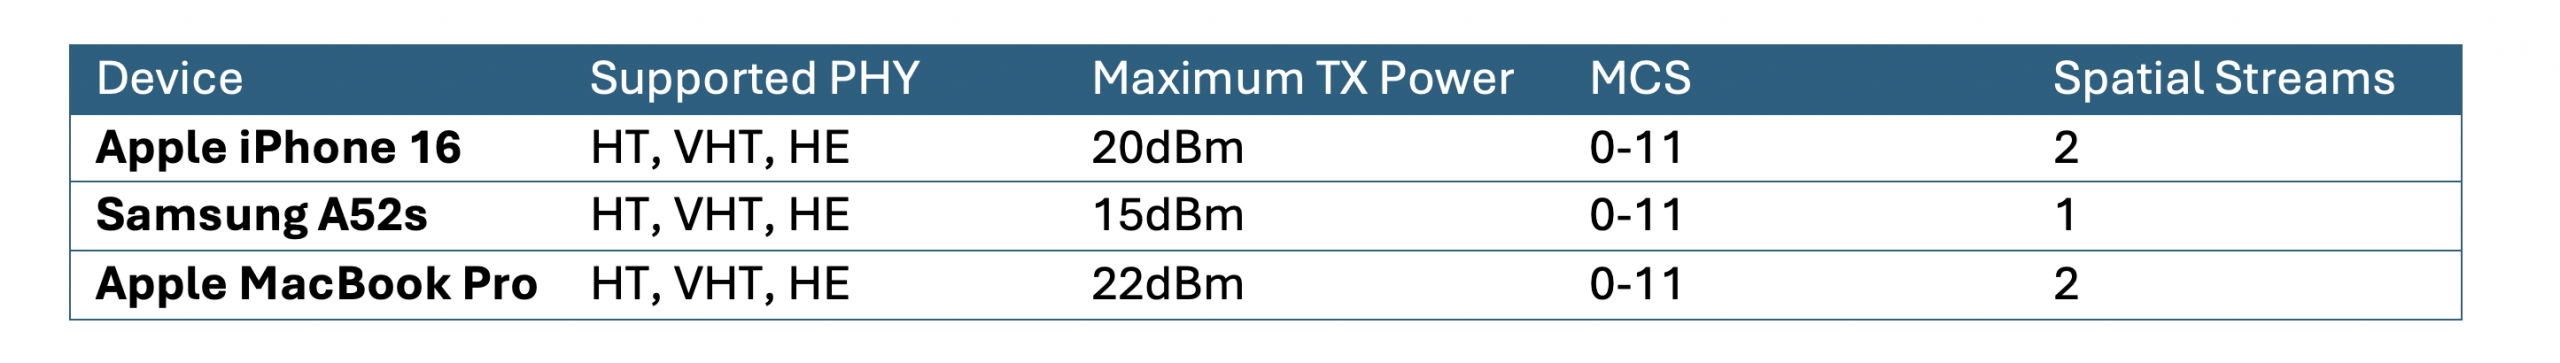
An association request frame was captured using a WLANPi/Profile application to understand each device’s capabilities before beginning the test.
I’m interested in the attributes supported PHY, maximum TX power, supported spatial streams, and MCS rate within the PHY, which are reported in various information elements.
For completeness, I also considered calculating the best RSSI that each device could support by considering the antenna receive gain of each device, as reported by some regulatory bodies, including the FCC report below on the iPhone 16.
However, I decided against pursuing this because I could not measure which antenna(s) would receive the signal on each device and how MRC or MIMO gains might have positively affected receiver sensitivity.
FCC Report: Apple iPhone 16 Antenna Gains Model(s): A3083, A3292, A3293, A3294
For simplicity, I first recorded the RSSI and SNR of each device as reported by the WLC.
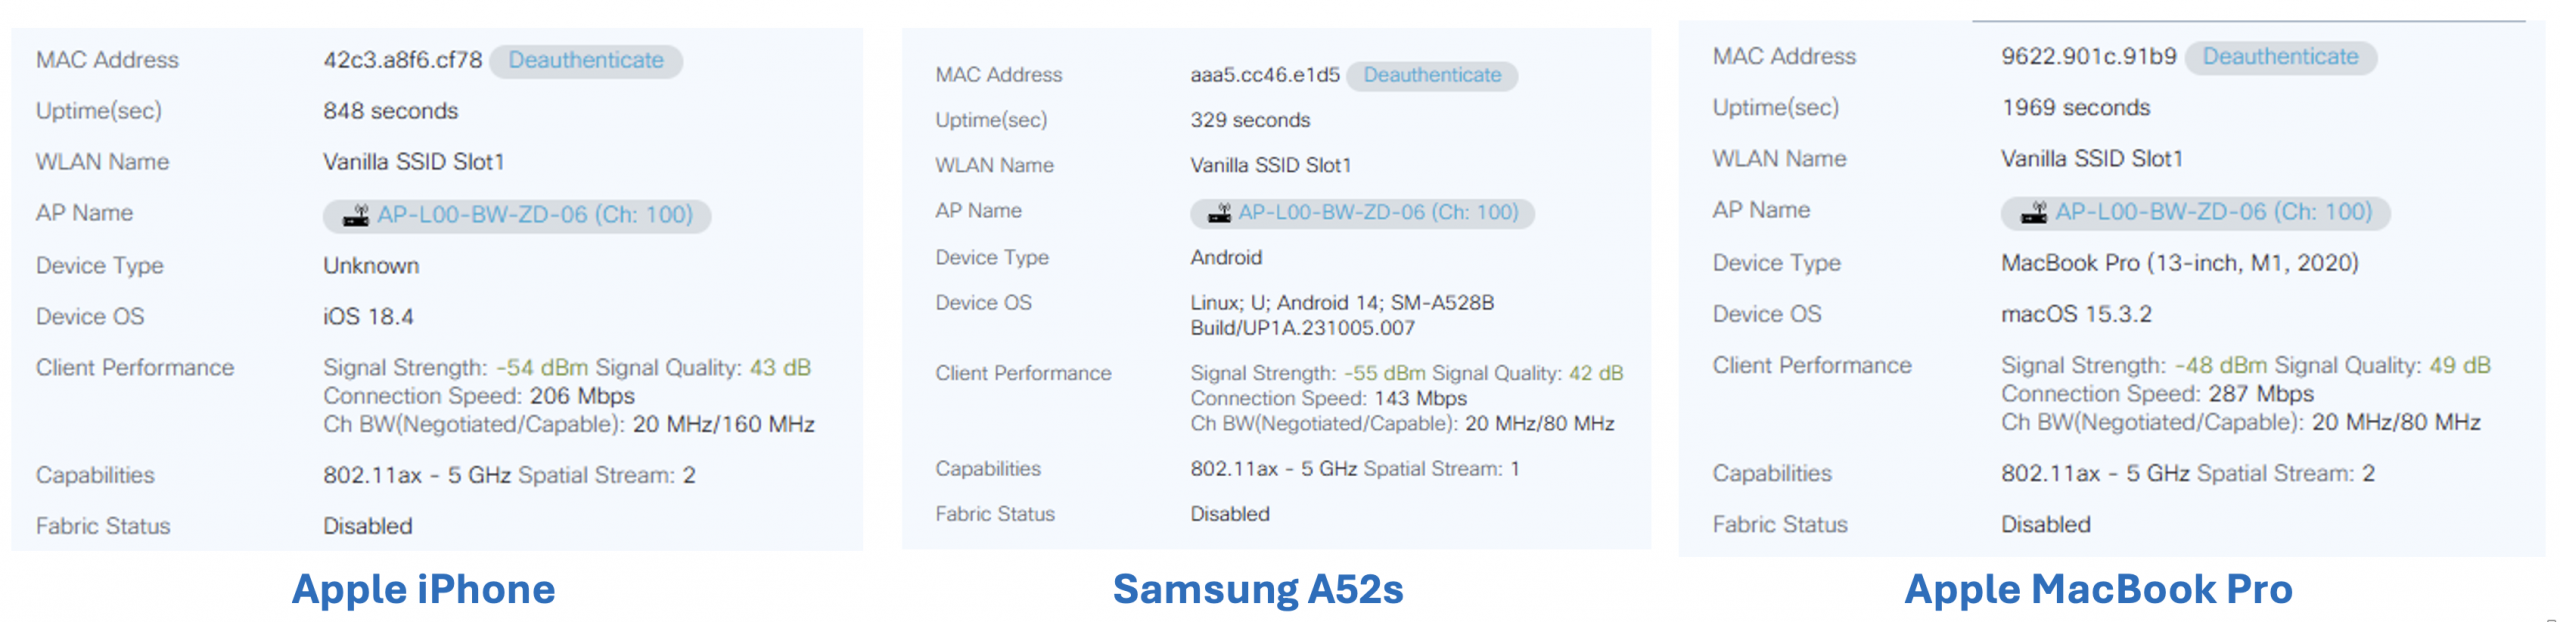
And then from each device’s UI
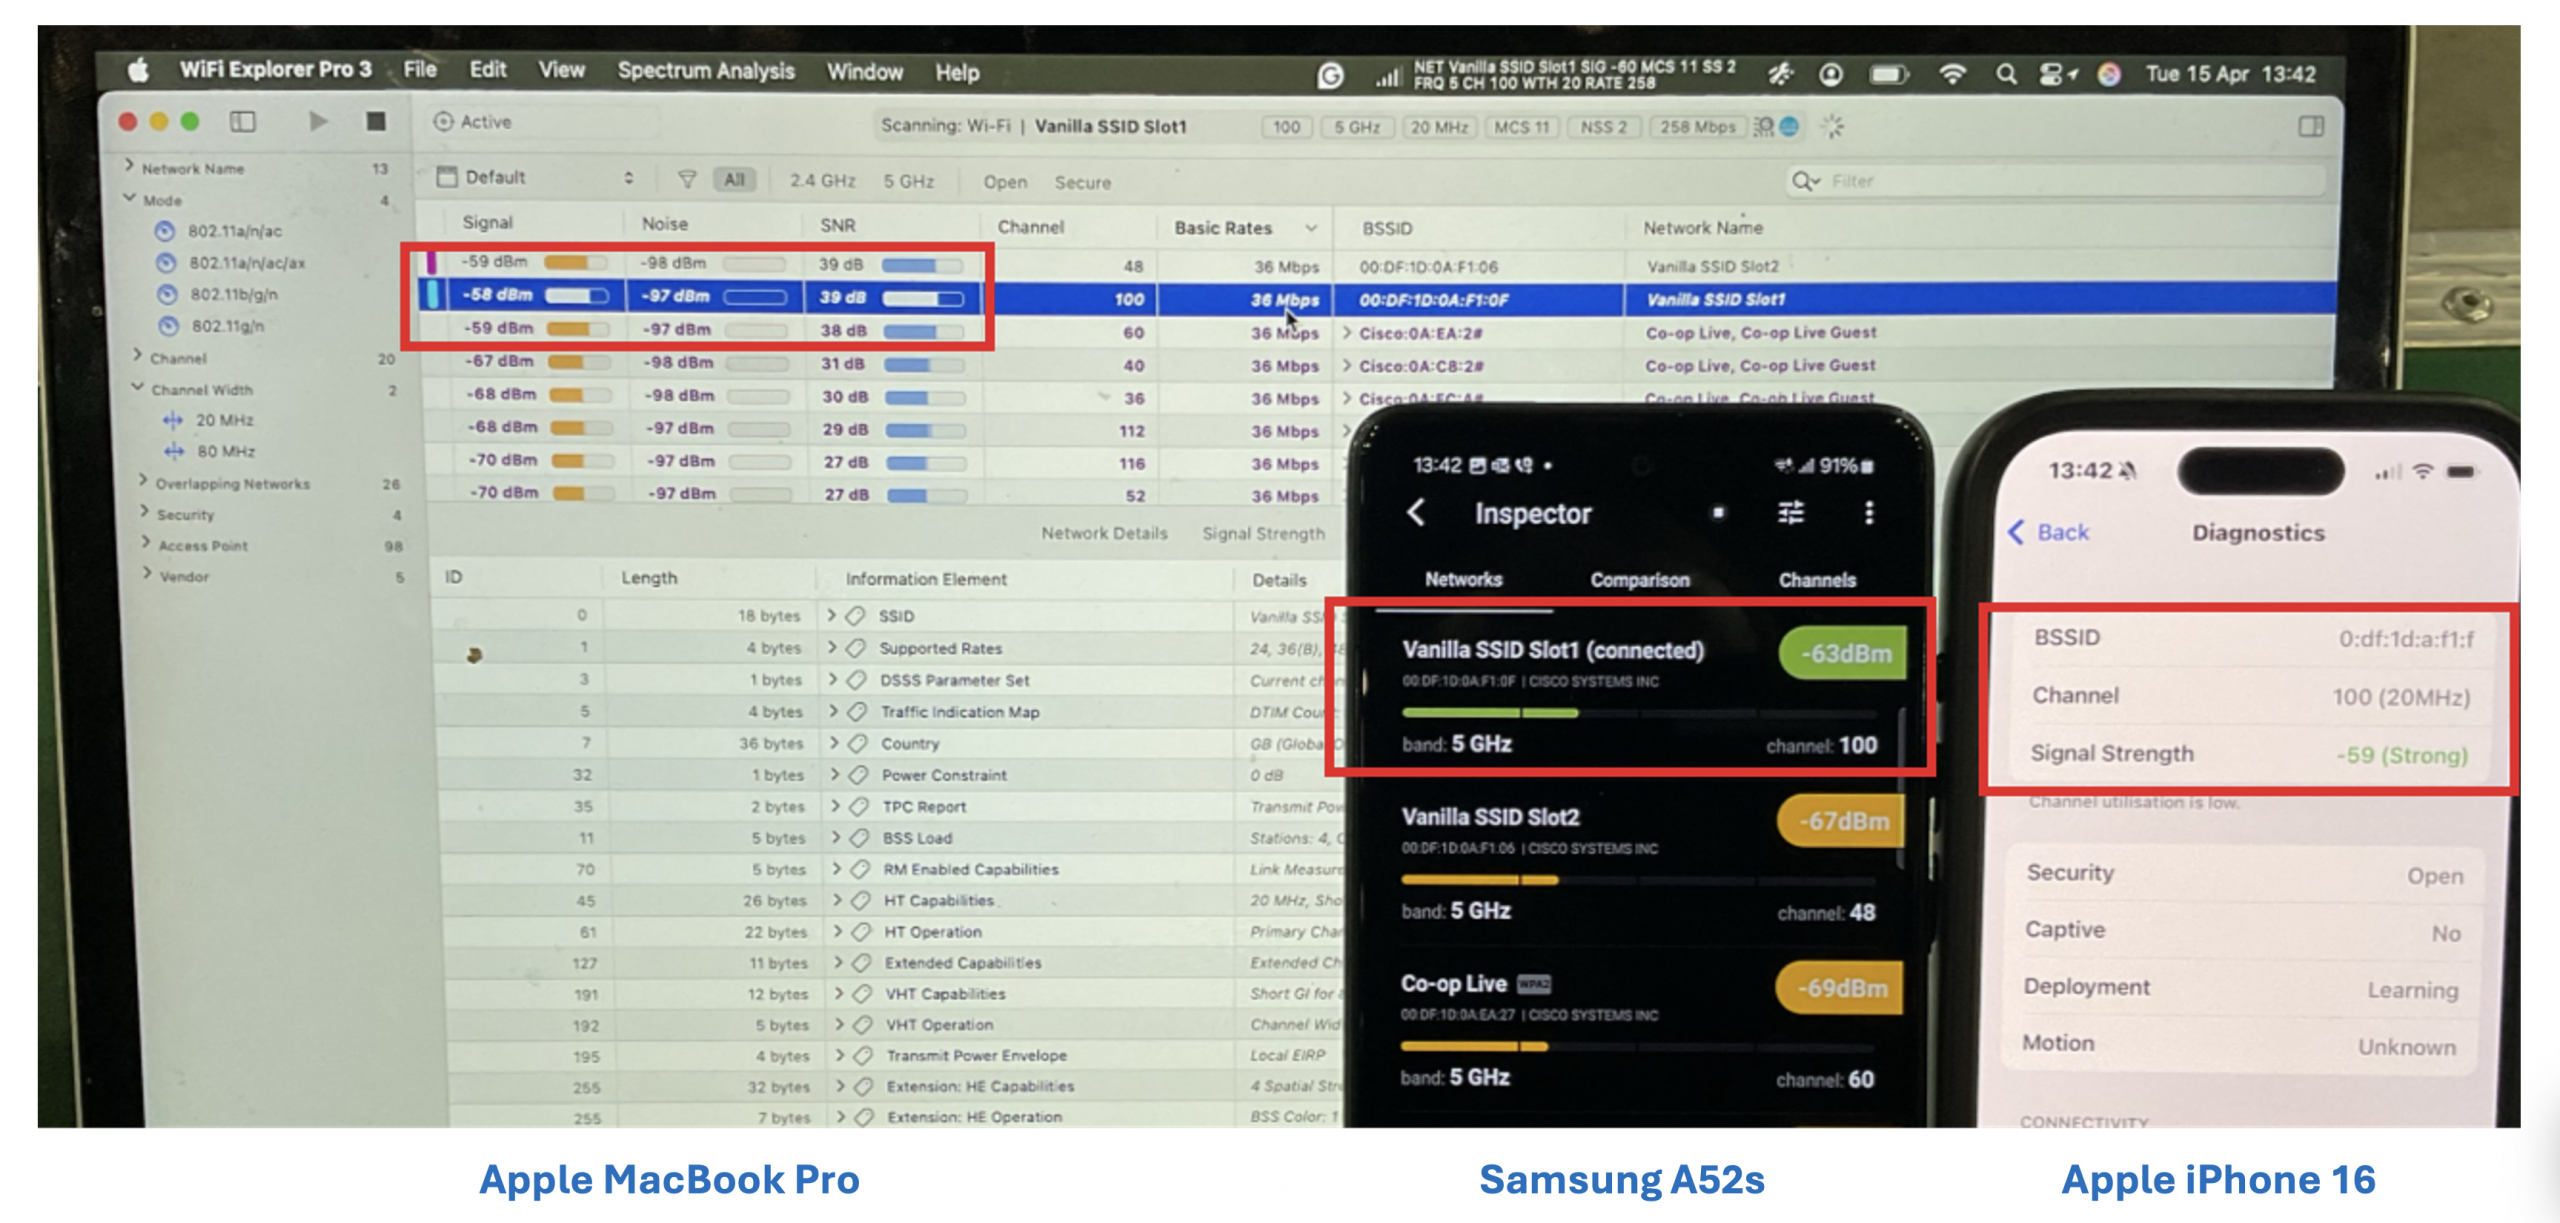
* I was unable to find an application that reported SNR on an Android device, and regretfully, when capturing the information from the iPhone, I should have used the “My Wi-Fi” Shortcut, which I did have on this device, but instead used the Apple Wireless Diagnostics Profile.
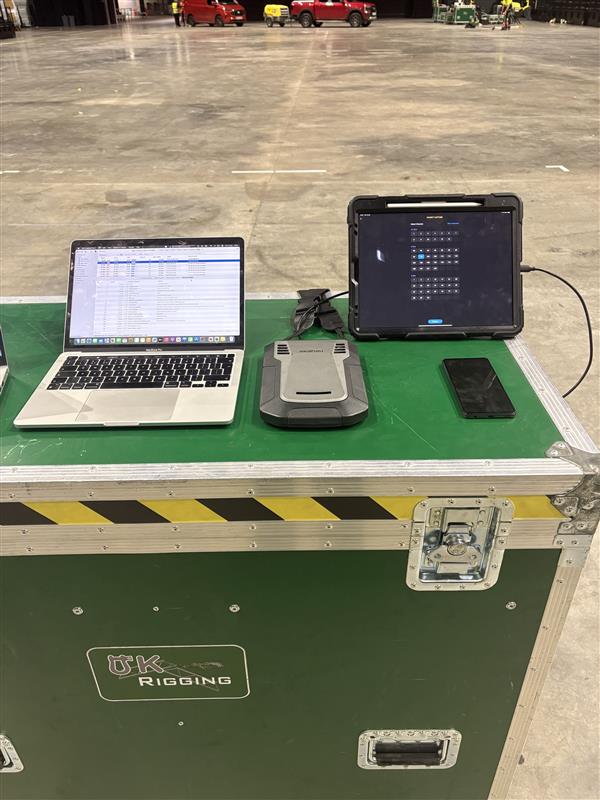
Packet Analysis
For packet capture, an Ekahau Sidekick v2 was connected to an Apple iPad running the Analyser app and placed directly next to the DoTs.
This was configured to capture on a single 5GHz 20MHz wide channel (100)
Throughput
Each device was subjected to throughput tests using Speedtest.net. I also considered using LibreSpeed on the WLANPi connected to a local network switch, but decided against it because I wanted this to be a real-world simulation, as most of the network traffic is directed towards the public internet.
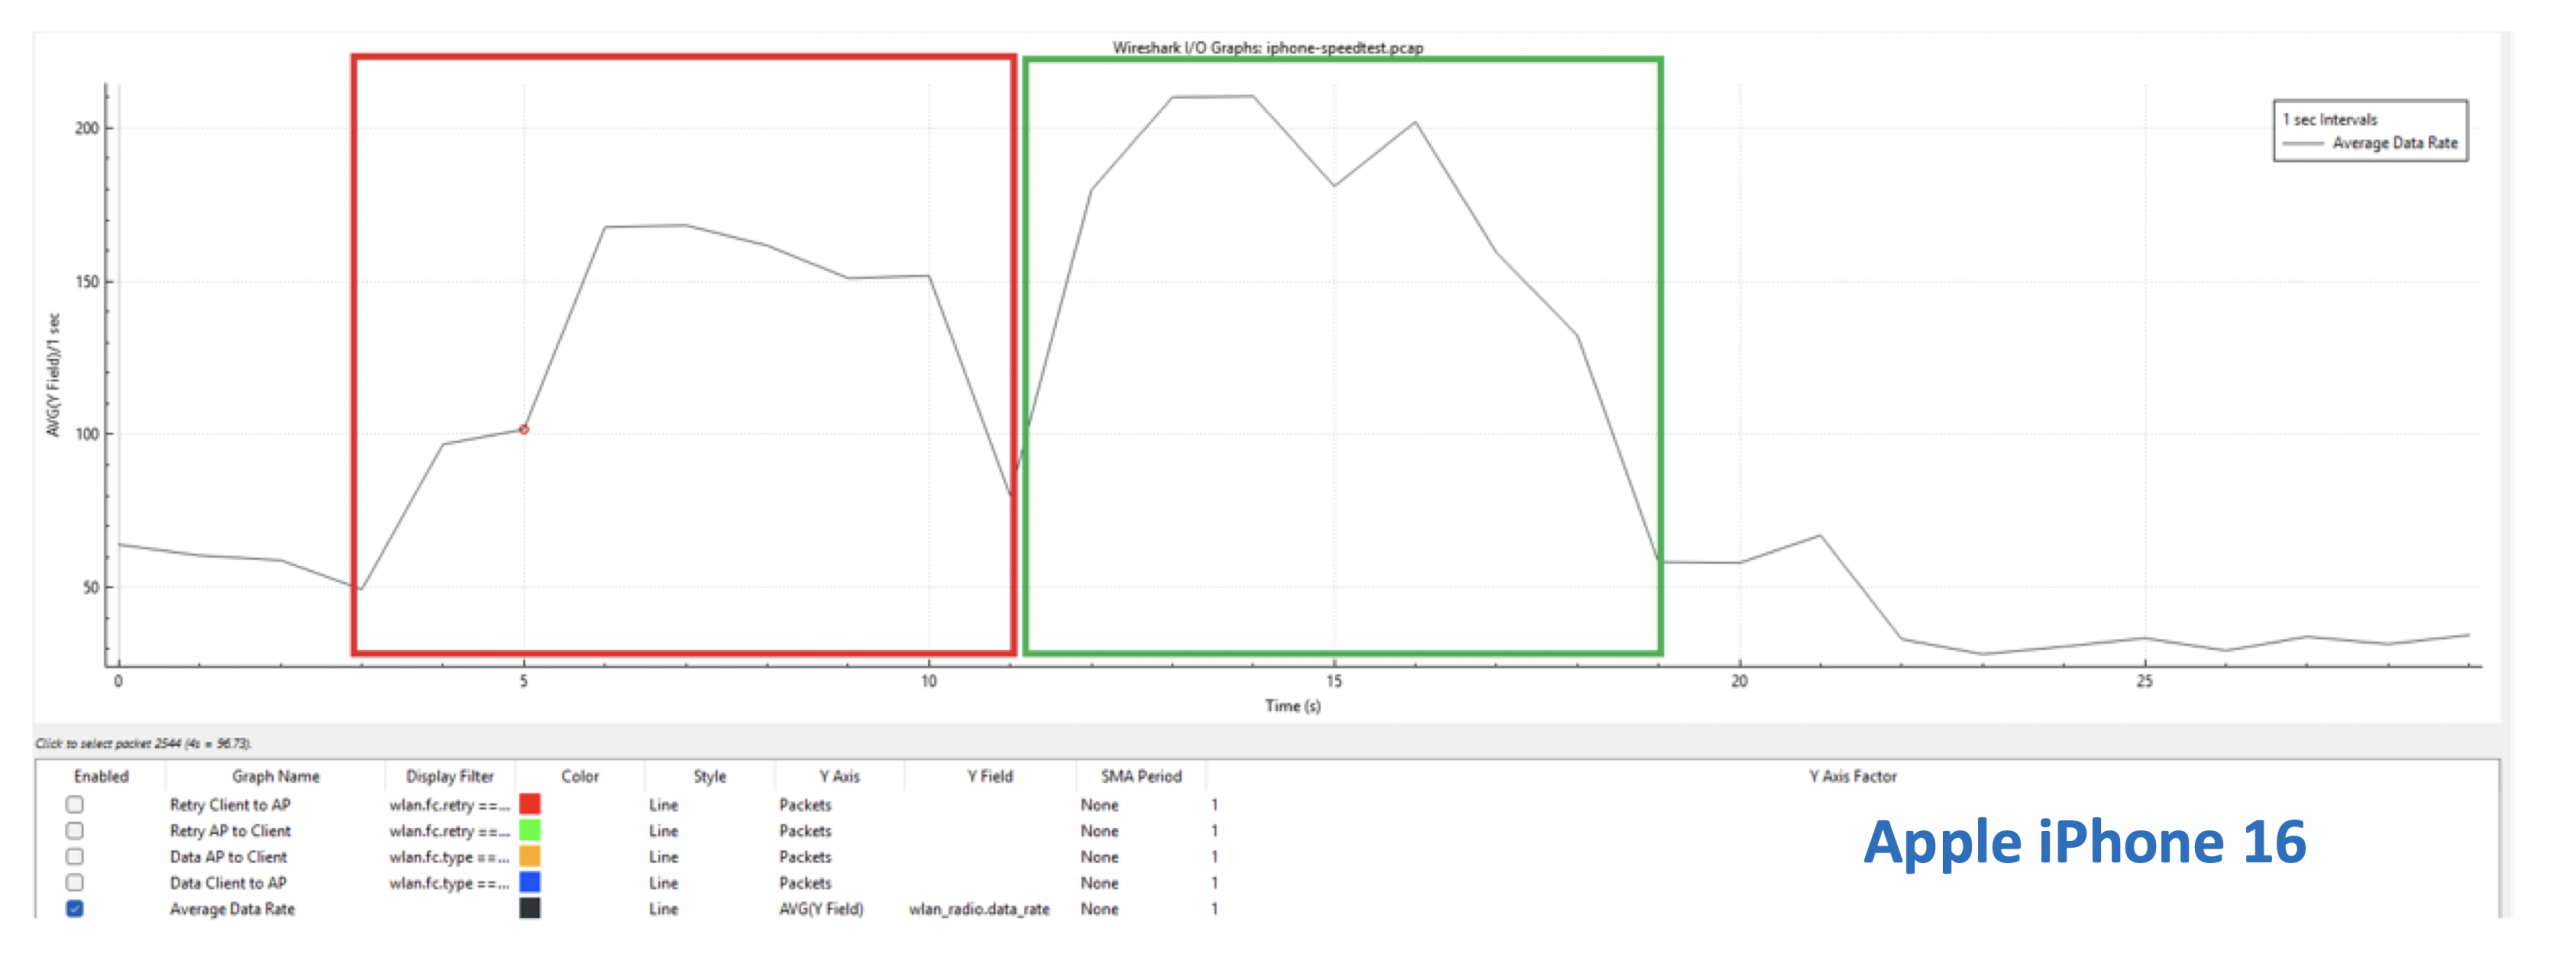
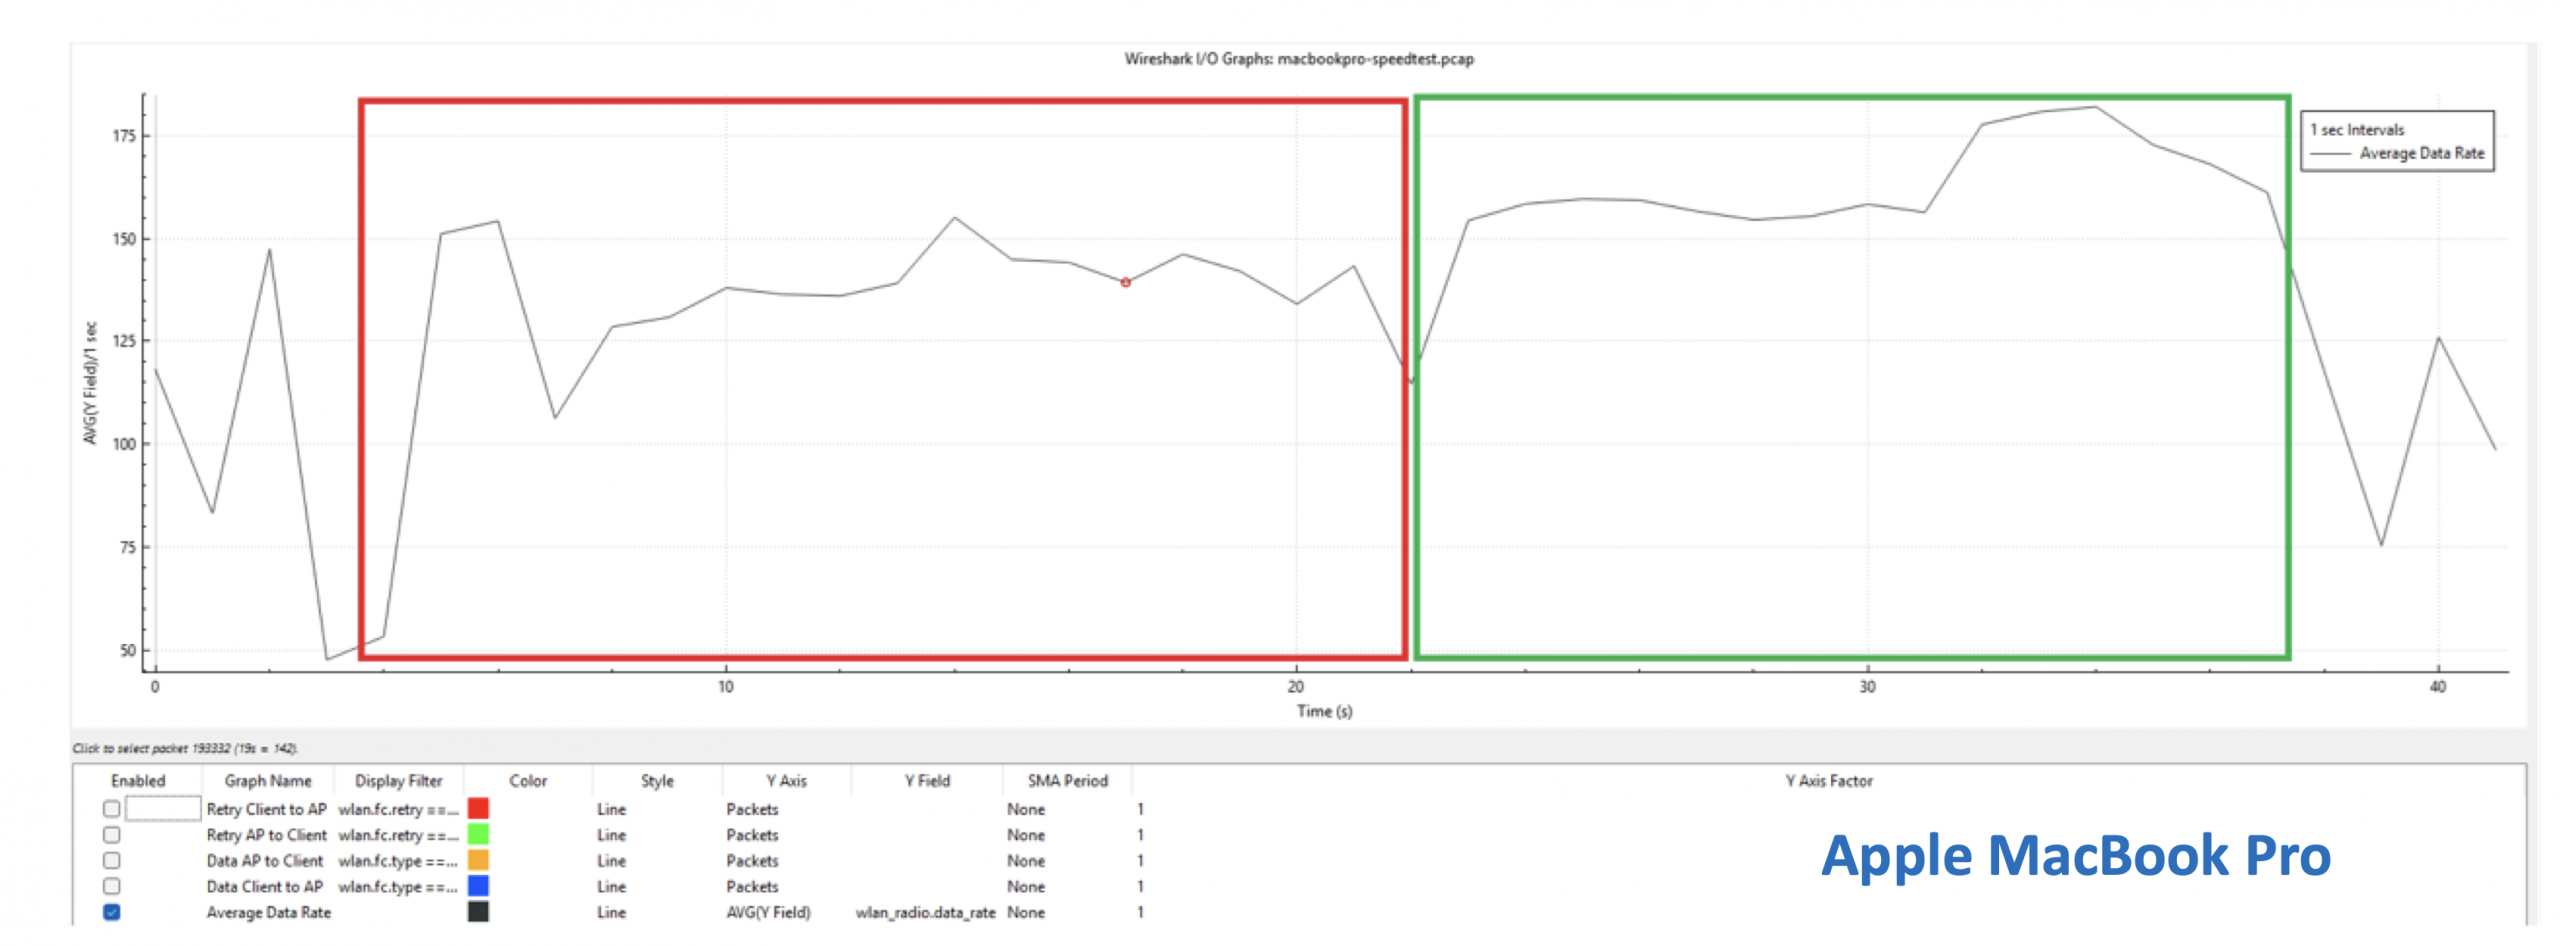
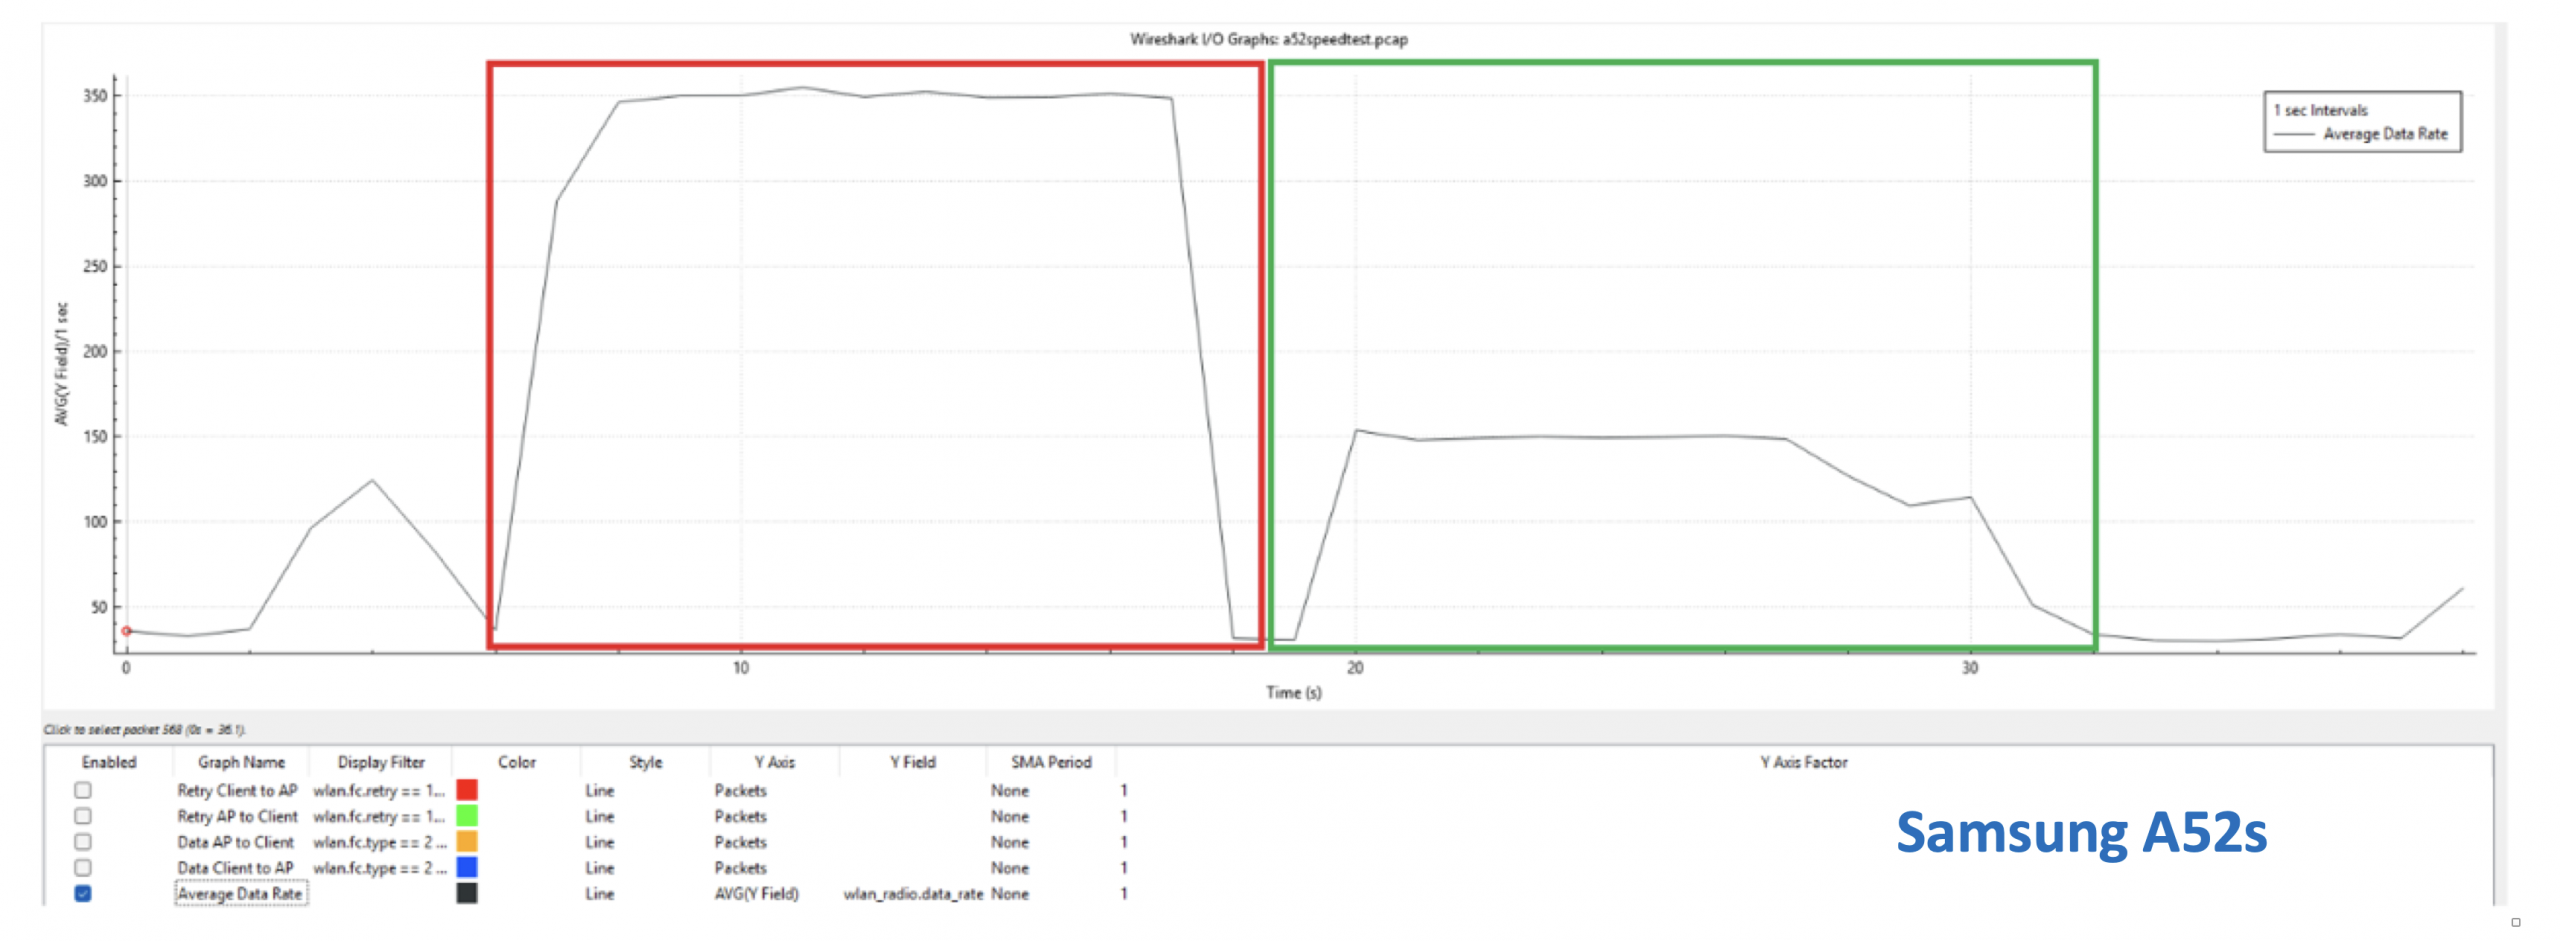
To begin with, I started looking at average data rates across each test cycle, using the Wireshark I/O Graph and a filter that looks at radio data rate (wlan_radio.data_rate)
- RED = Downlink
- GREEN = Uplink
Apple iPhone 16
Apple MacBook Pro
Samsung A52S
Rate Adaptation
I then started looking at factors that may trigger rate adaptation. Manufacturers don’t release this information, but the assumption is that the majority use a variation of Minstrel.
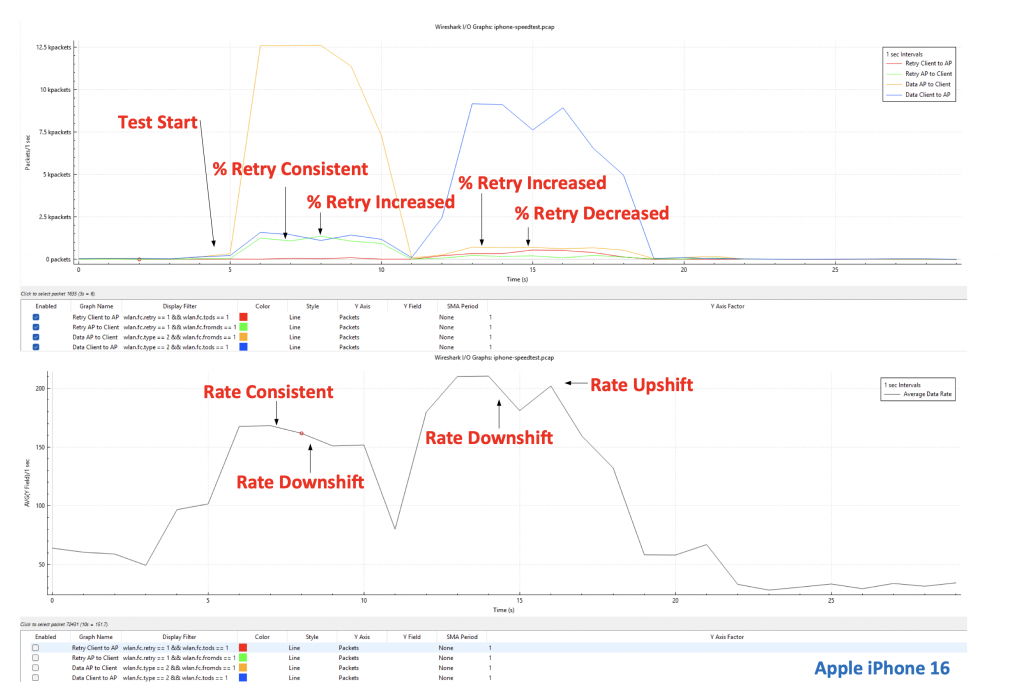
I was hoping to see evidence, though, that the device was sampling link quality and that there was a direct correlation between when retries occurred and the associated rate shifts.
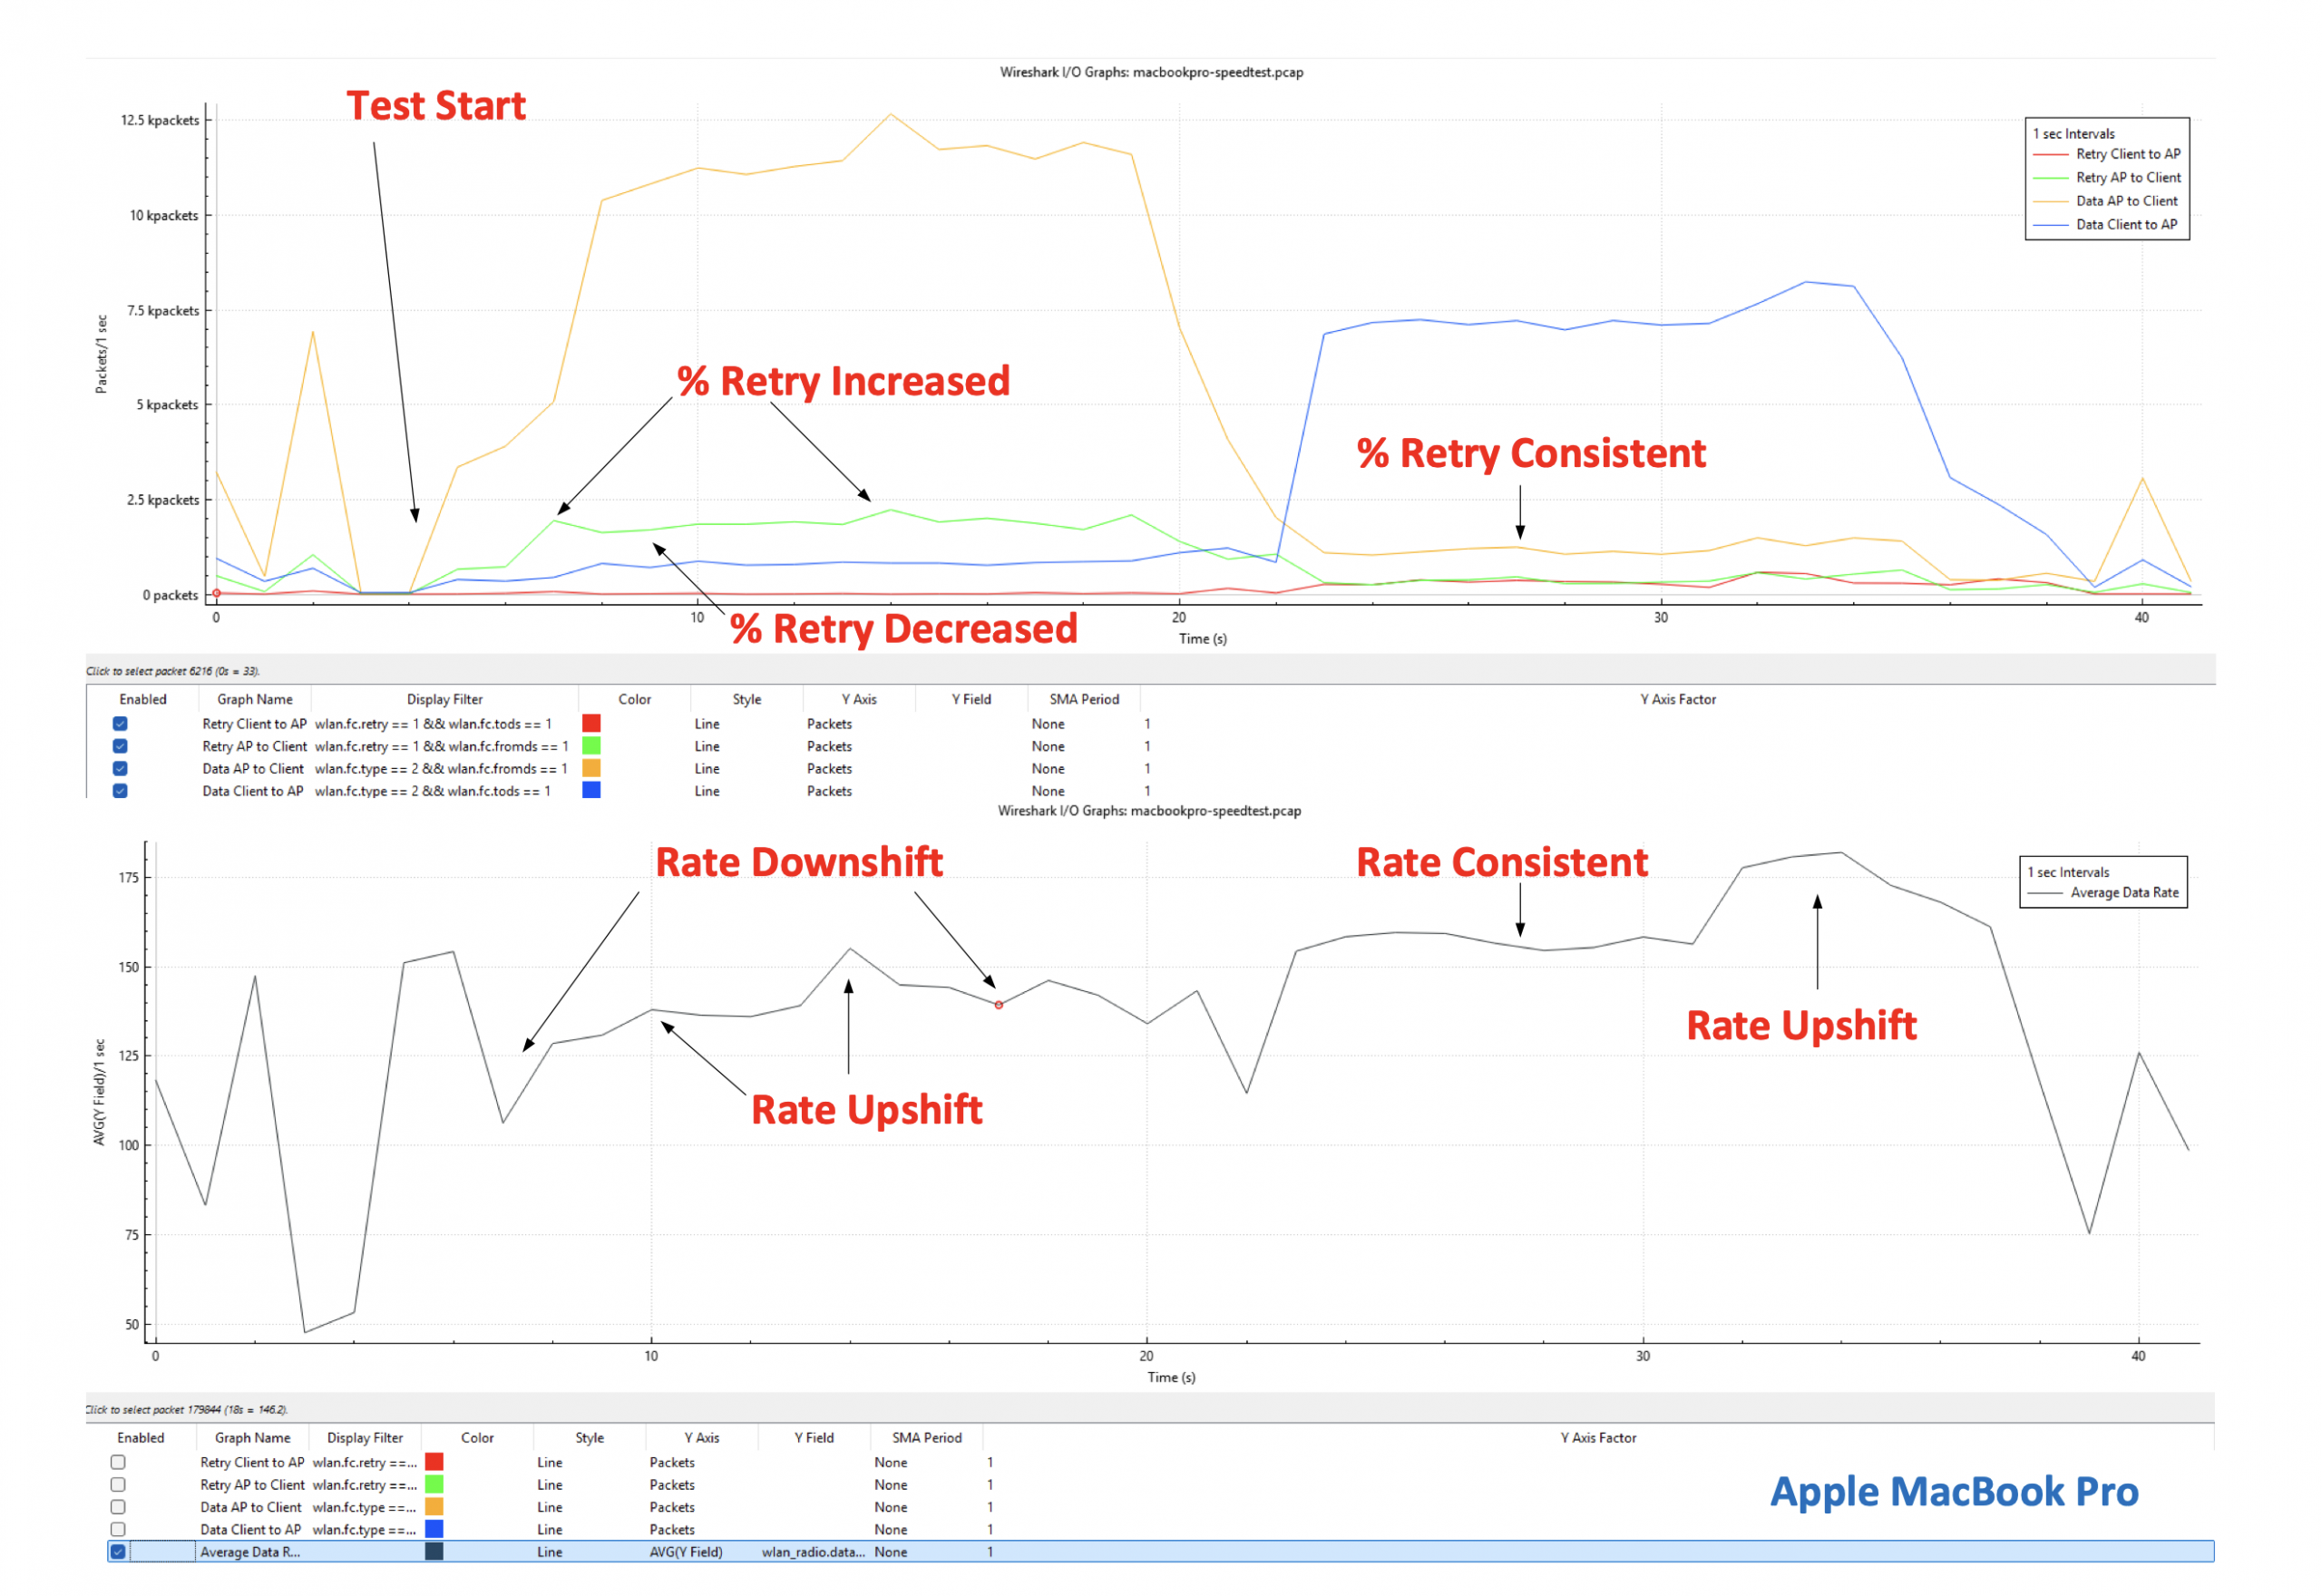
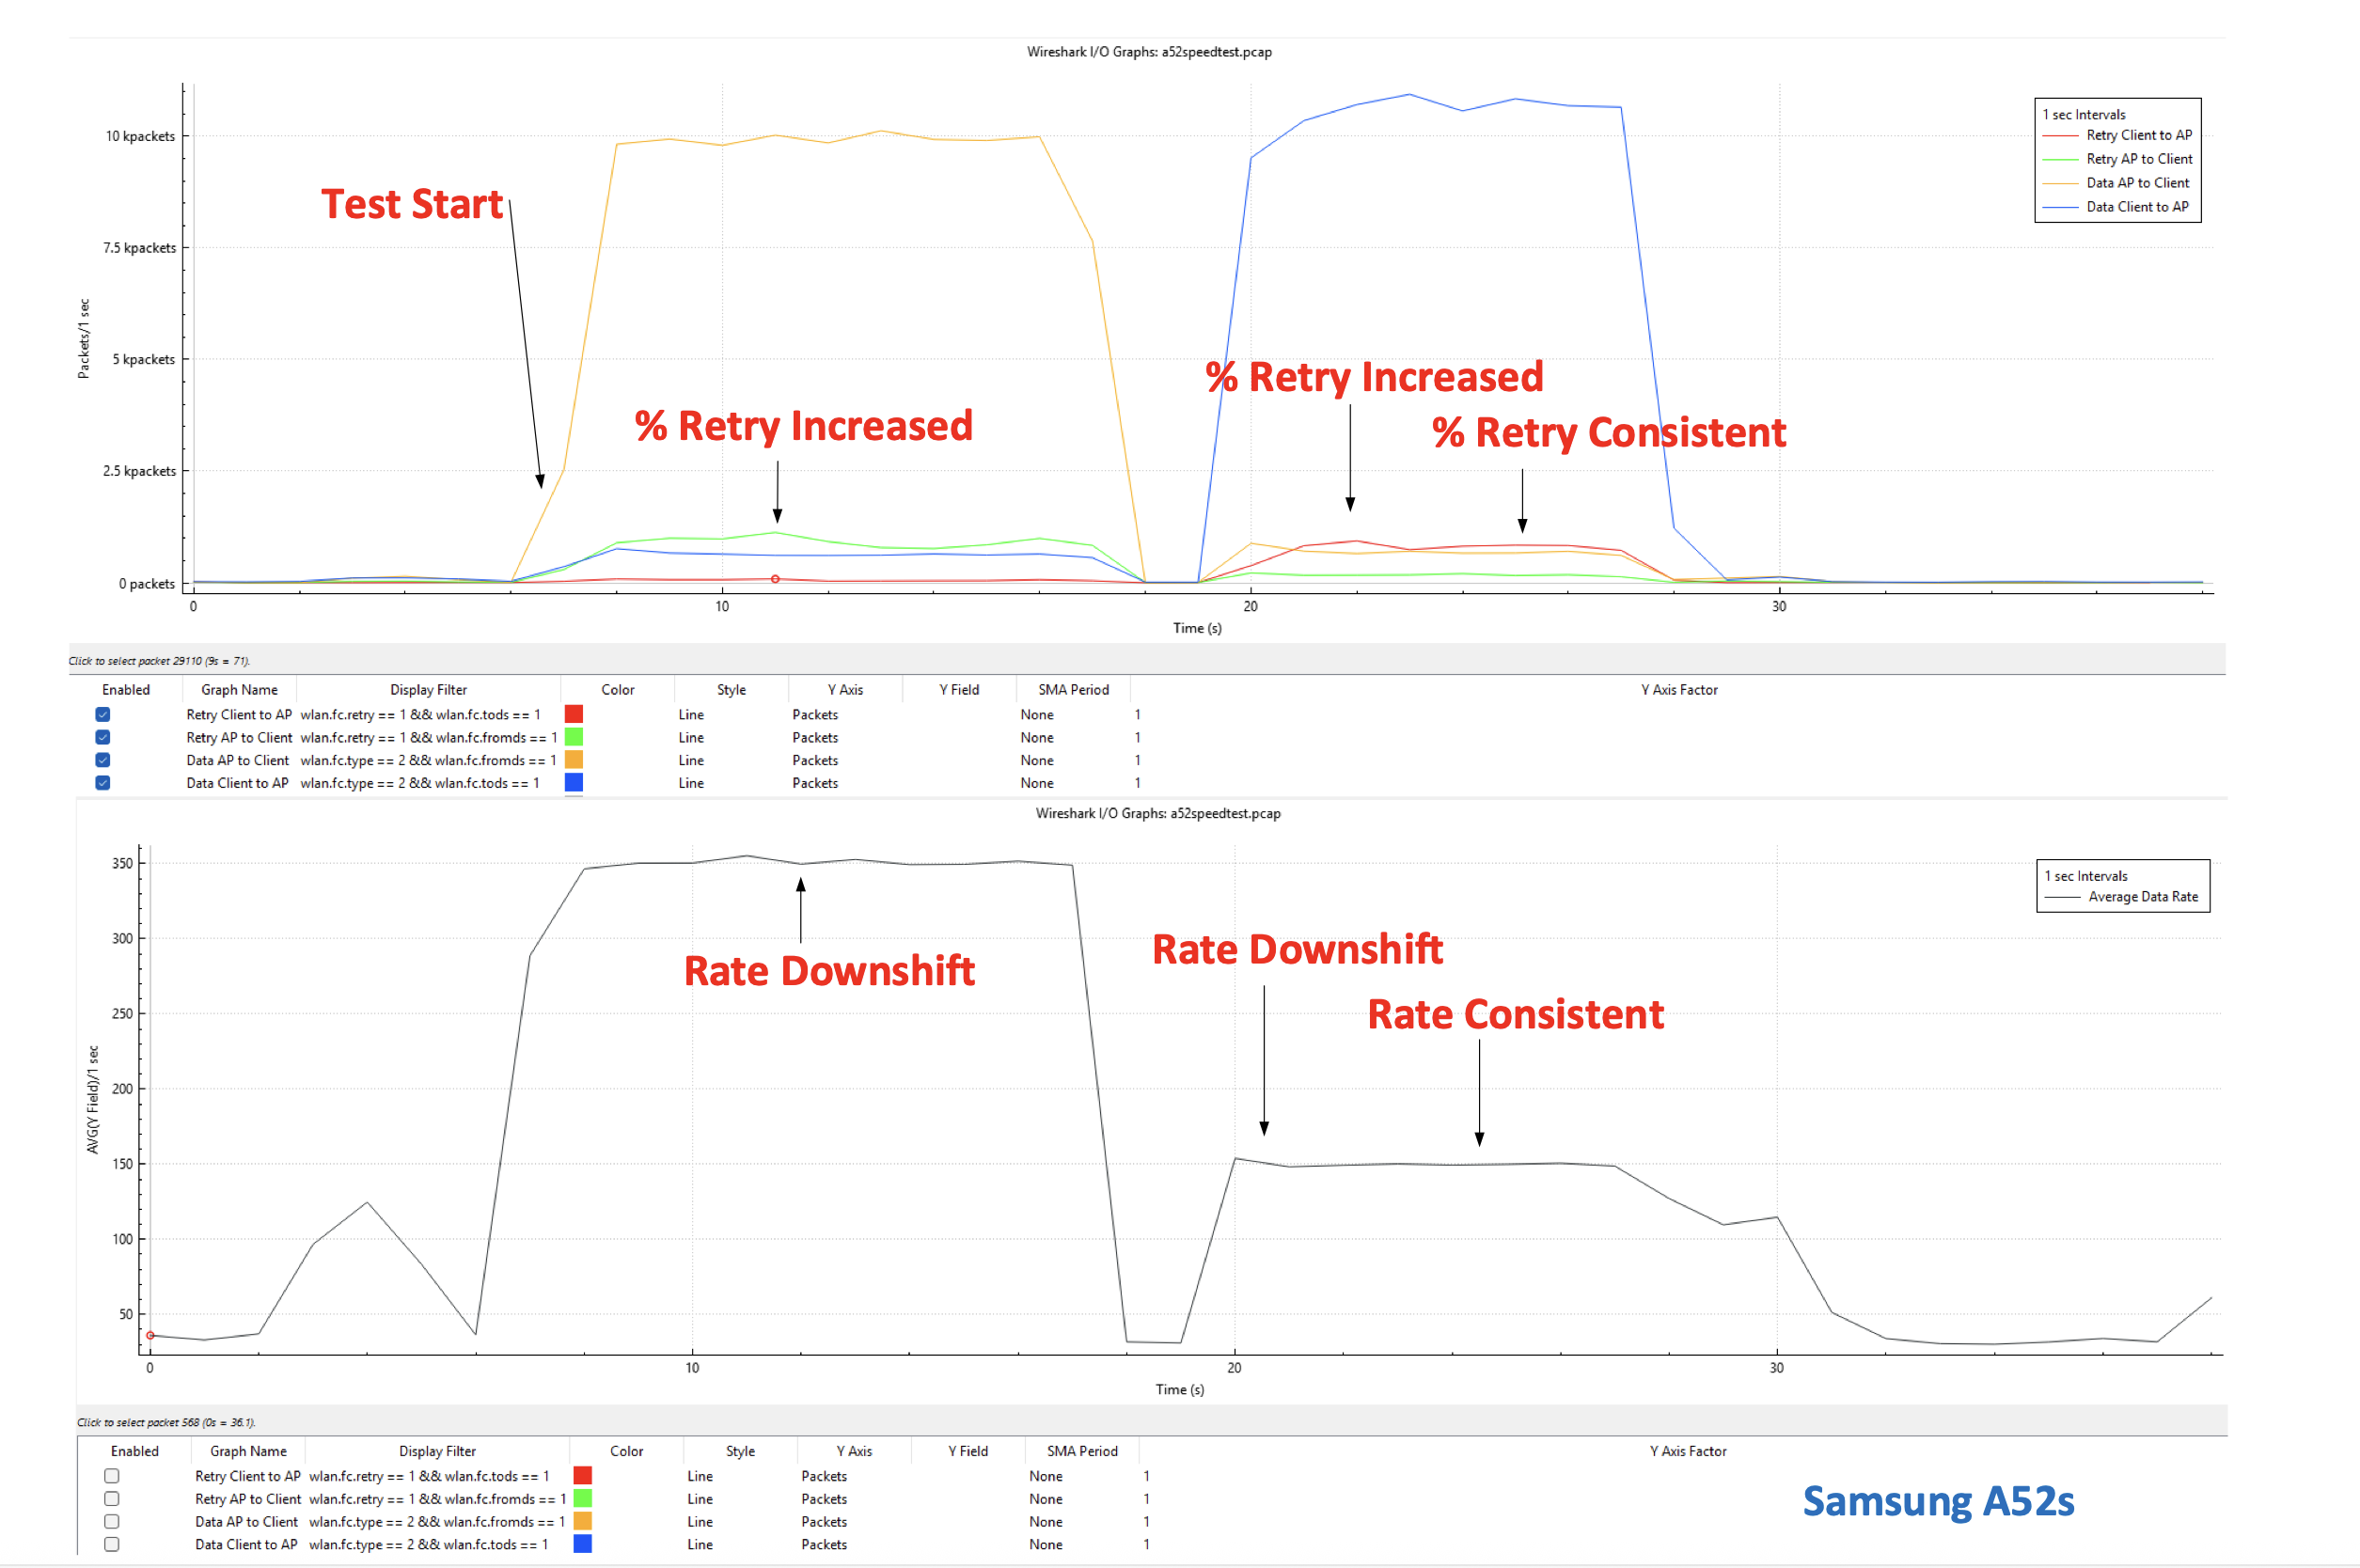
I again used the Wireshark I/O Graph but added additional filters to examine retries and data frames in uplink and downlink.
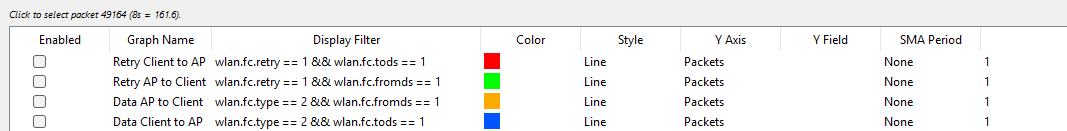
In the following visualisations, I highlighted where rate shifting occurs based on the percentage retry rate.
Apple iPhone 16
Apple MacBook Pro
Samsung A52S
Summary
As expected, due to the slight imbalance in how well the AP hears the client devices (To DS), there is a noticeable bias on the uplink transmissions, with typically higher average throughput than on the downlink (From DS).
What is very interesting, though, is that the performance of the Samsung A52s, when profiled, reported that it was only capable of 1 Spatial Stream. However, when reviewing the packet capture, it is, in fact, a 3 Spatial Stream device, which has a significant impact on throughput (MCS10) but only on the downlink.
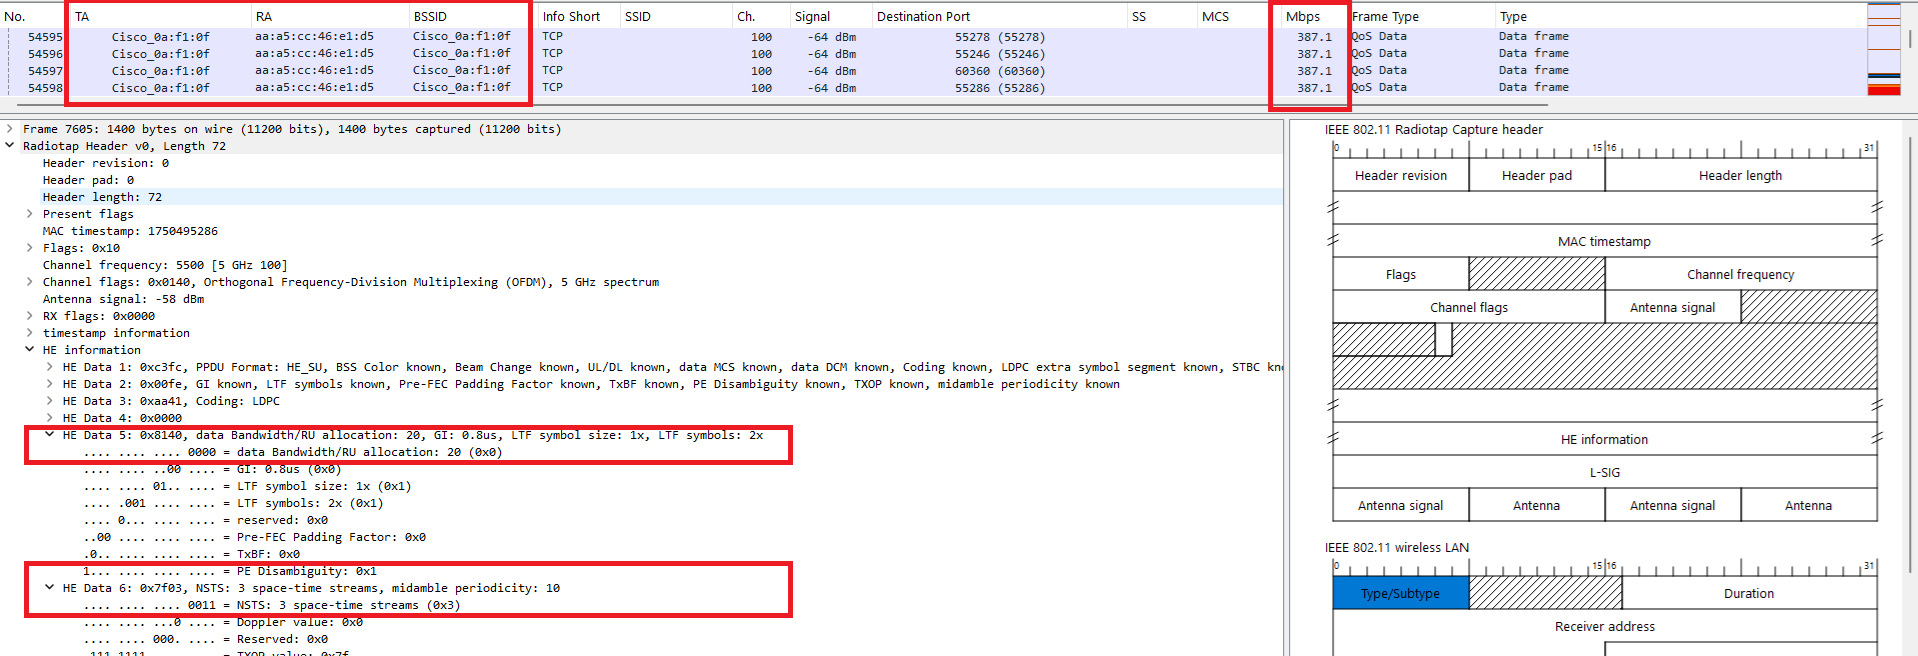
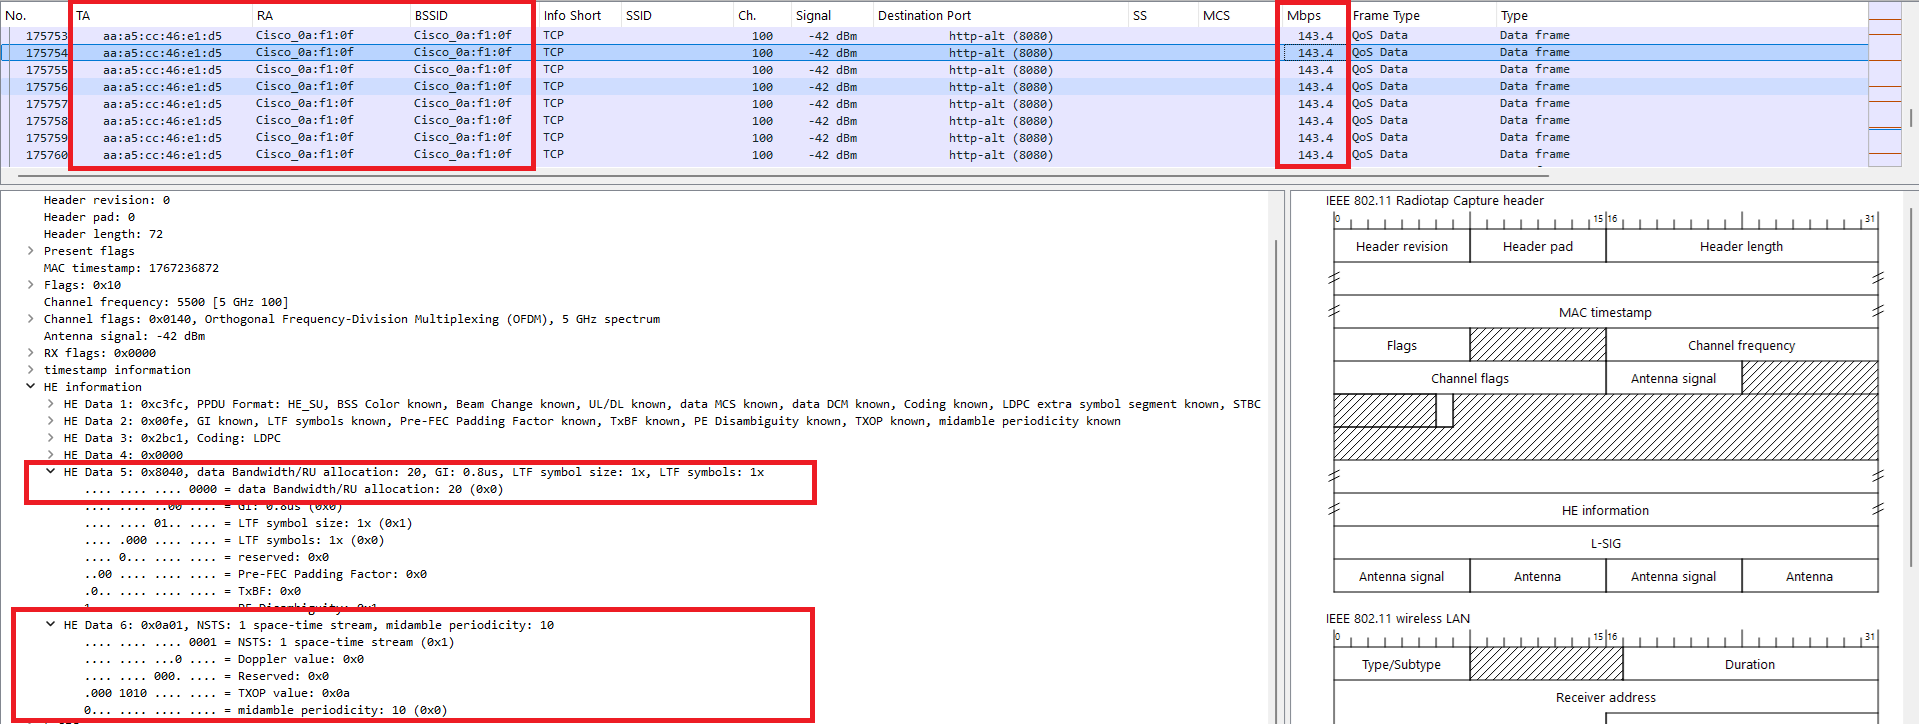
When reviewing the capture showing uplink transmissions, I found that this was transmitted using only 1 Spatial Stream (MCS11). I can’t explain why the device does this, but I can only assume it’s deliberate by the manufacturer.
Even with these factors considered and the lower TX power of the DoTs, it seemed to be the most stable.
In summary, from what I can visualise in the packet captures, rate adaptation is occurring, albeit with minor fluctuations likely caused by asymmetry between the transmitter and receiver.
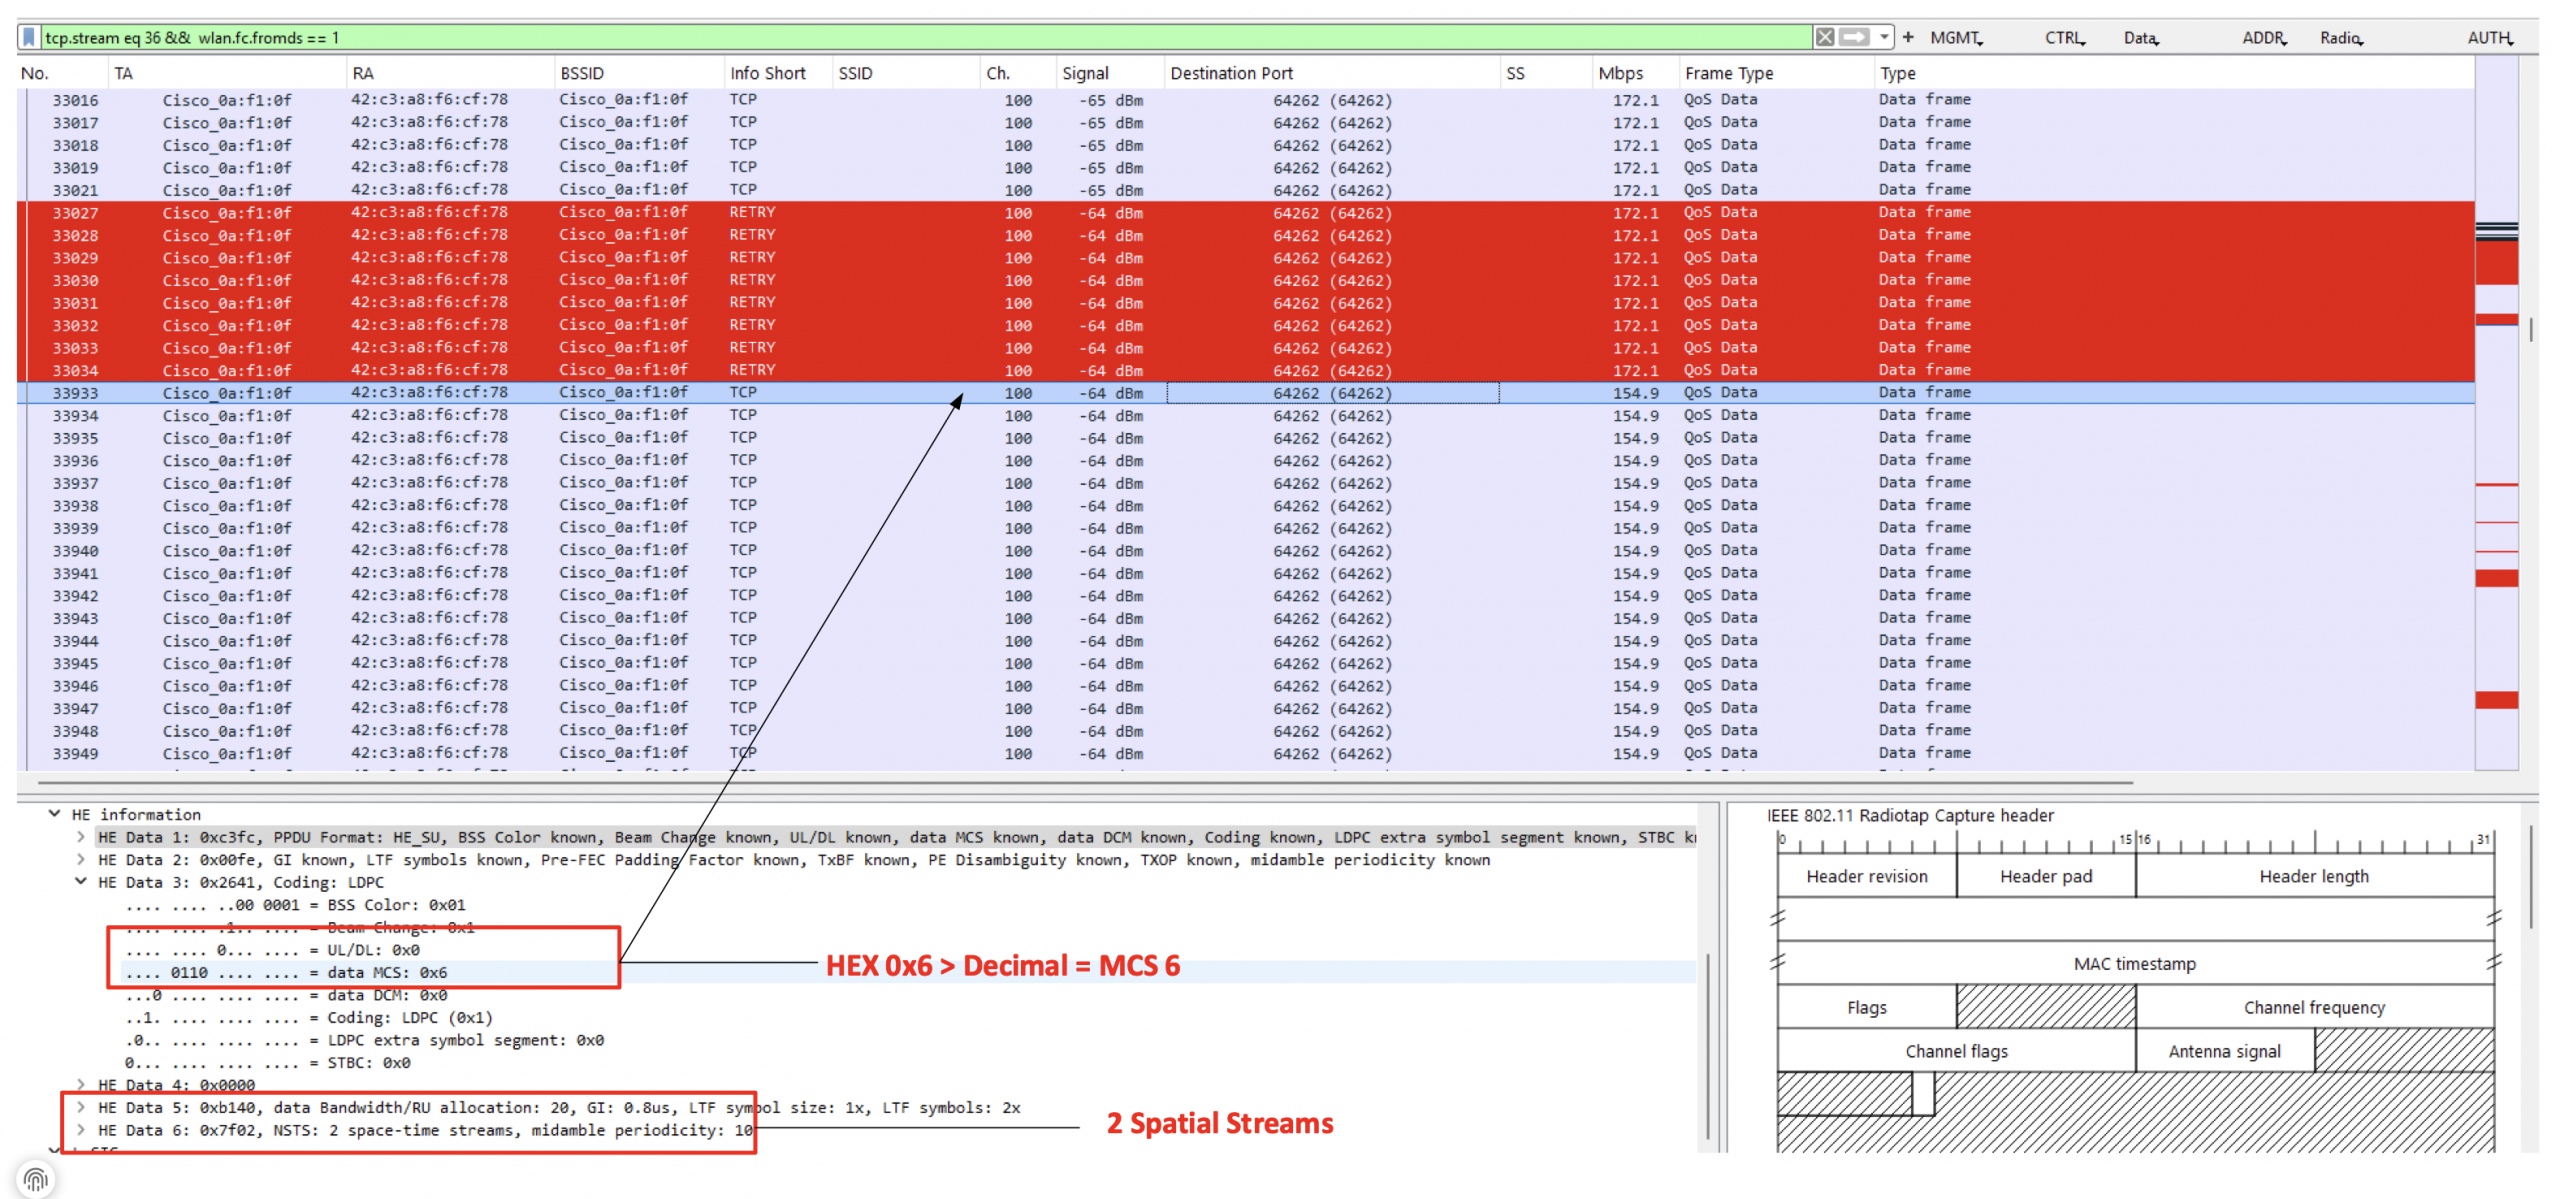
The acid test observes the shift in MCS rate, which seems to occur following retry frames sent from the AP.
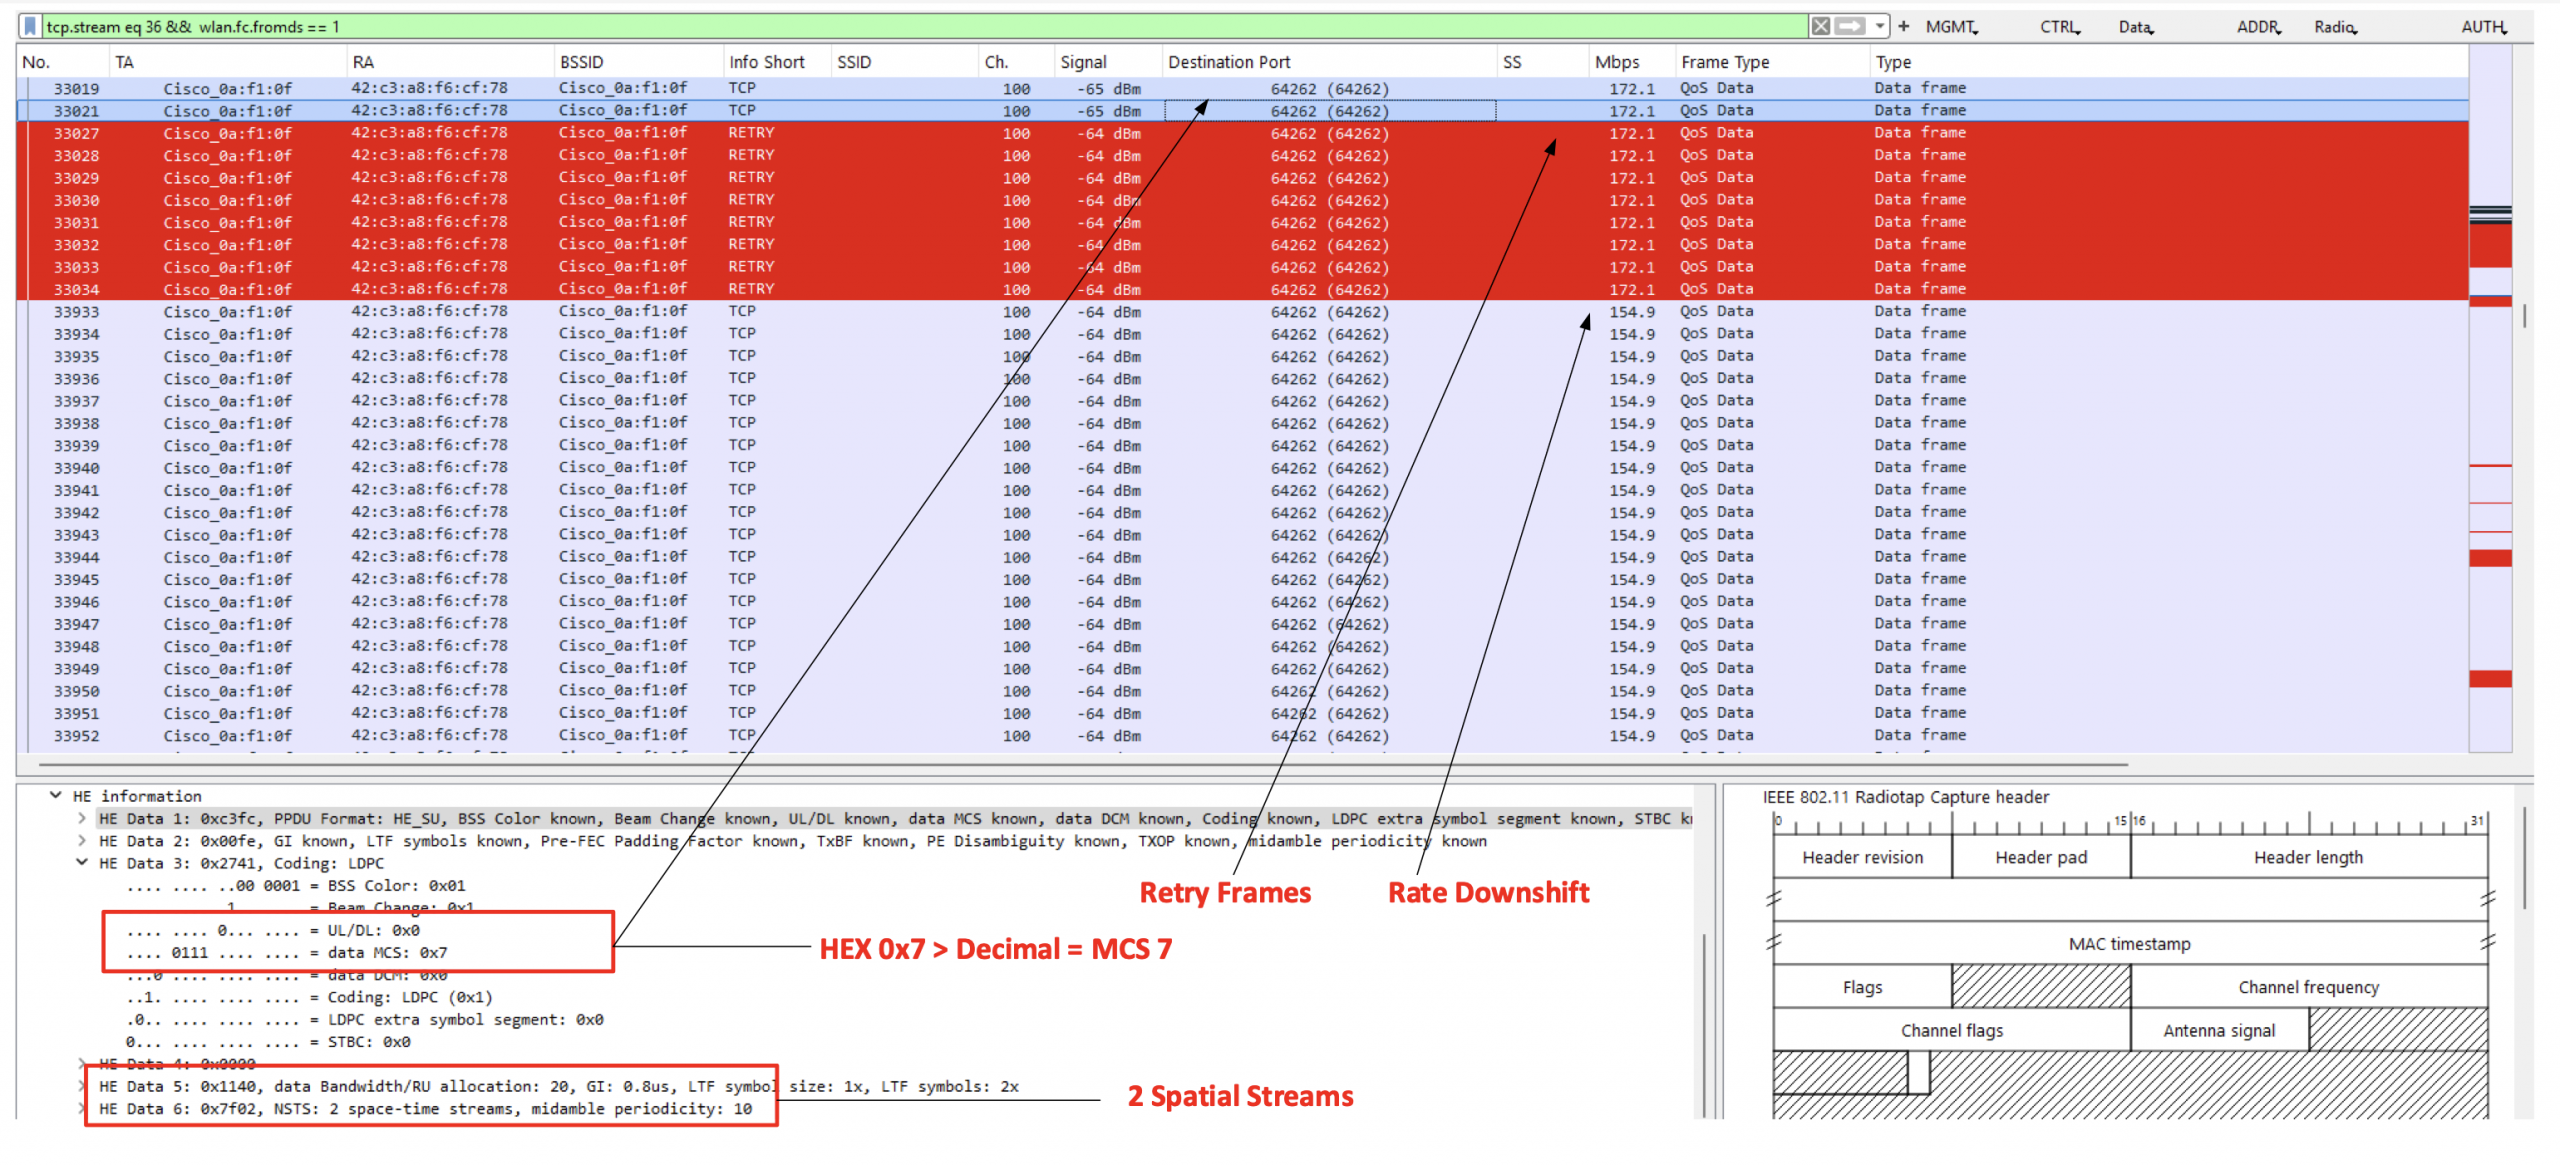
In this instance, we can observe data frames sent at MCS 7, a period of retires and a downshift to MCS 6.
To close out, can this be improved upon? Possibly, but I take solace in the fact that when this occurs, I don’t see a significant variance in MCS, i.e., Downshift.
I could consider marginally increasing TX power at the AP to improve downlink performance. However, this is not an option due to band locking on this AP and the need to closely match TX power across both radios to ensure client load balancing.