Introduction
For this project, the design brief required the provision of very high-density Wi-Fi coverage within an indoor live music arena for a user population of up to 23,500, and a design that would be able to guarantee support for up to 50% of general attendance (Take Rate) and 2Mbps per user, regardless of the event.
Wireless networks are considered Very High-Density (VHD) when the typical user density is an average of 1 user per 0.5 m2. Because of this factor, determining where to locate access points (APs) and the type of AP and/or associated antennas imposes several challenges.
Overhead Installation
A design that positions the AP above the intended service area and at an increased distance, typically between 15-35m, all apparatus is typically affixed to a permanent structure that forms part of the roof, such as trusses, beams, girders, columns and pylons. If a gantry/walkway system is installed, this allows for a more favourable line of sight to the seated or standing areas below.
Pros and Cons
Overhead designs are gaining increased popularity due to a lower overall installation cost, good performance across a broader range of use cases, and excellent adaptation to fluctuations in venue occupancy.
The main challenge when installing overhead is using an antenna configuration with very tight side lobes. Failure to do so will allow RF signals to bleed into neighbouring coverage areas, causing co-channel contention, an increased retry rate, decreased throughput, and higher latency.
Reducing the radio power can lessen this impact to a degree, but doing so has a proportional impact on the range or throw of the antenna, resulting in a poorer signal-to-noise ratio at the receiver. This balance is hard to achieve, especially as the noise floor can increase by 10dB or more during an event, and higher TX power is needed to overcome this.
Solution Design
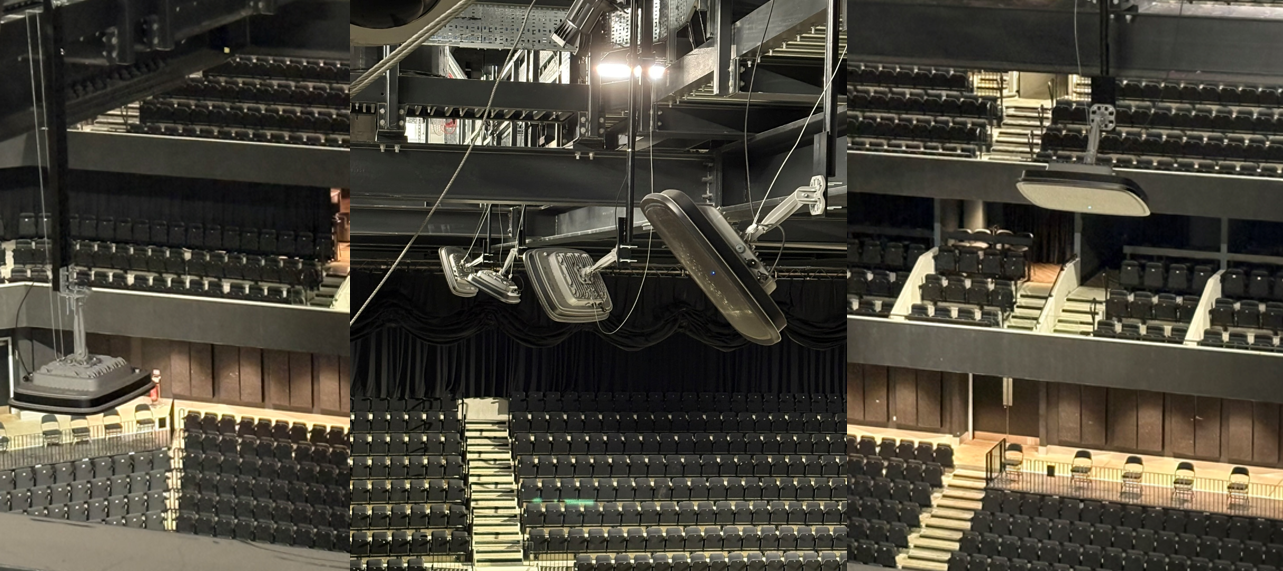
The bowl within the venue is comprised of multiple tiers on an increasing angle of incidence, starting at 20° in the lower bowl and reaching 57° in the upper bowl. Due to the presence of an overhead gantry and an enclosed roof, this presented an excellent opportunity for affixing APs, as it gives a clear line of sight to the whole arena.
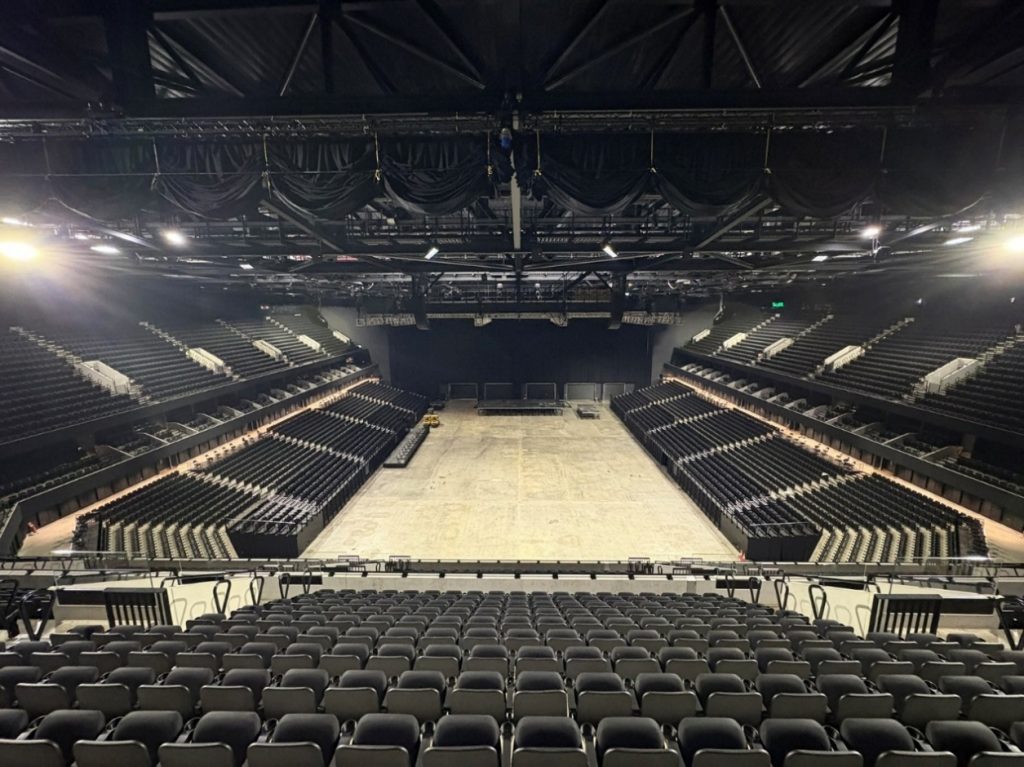
Figure 1 – Arena Bowl
The seating configuration can change dynamically depending on whether the performance is seated or standing and whether the stage is central or rearward. This has a significant impact on venue capacity, as full venue occupancy is only possible when the stage is central to the arena.
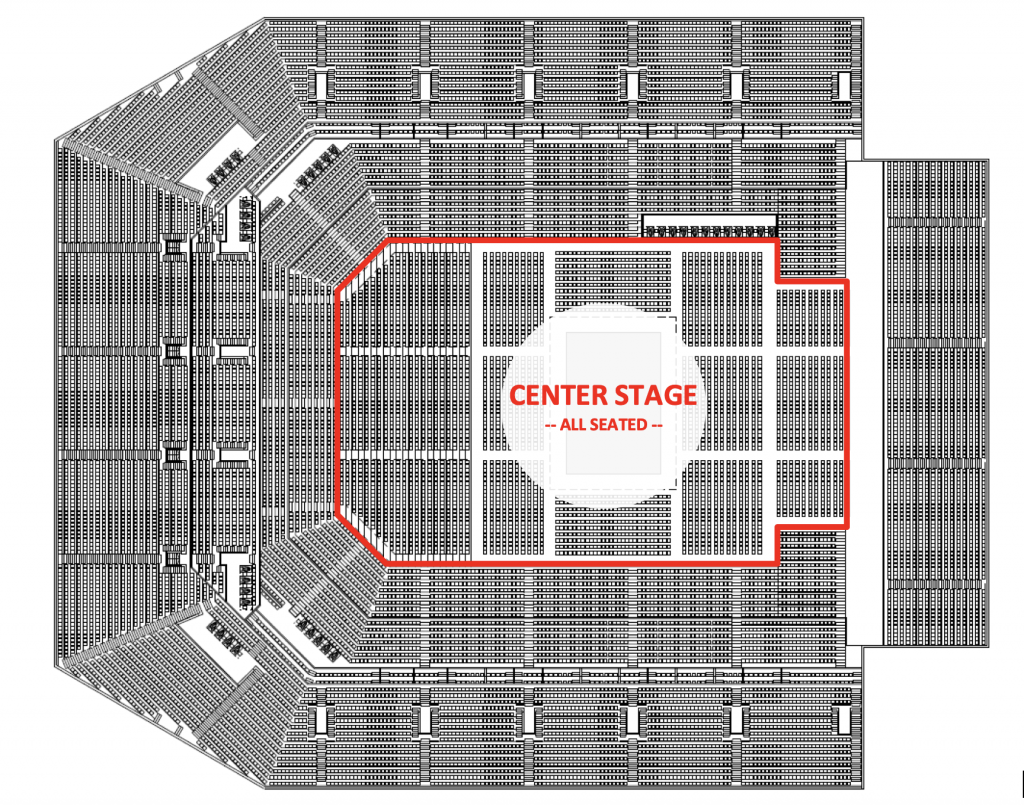
Figure 2 – Center Stage Configuration
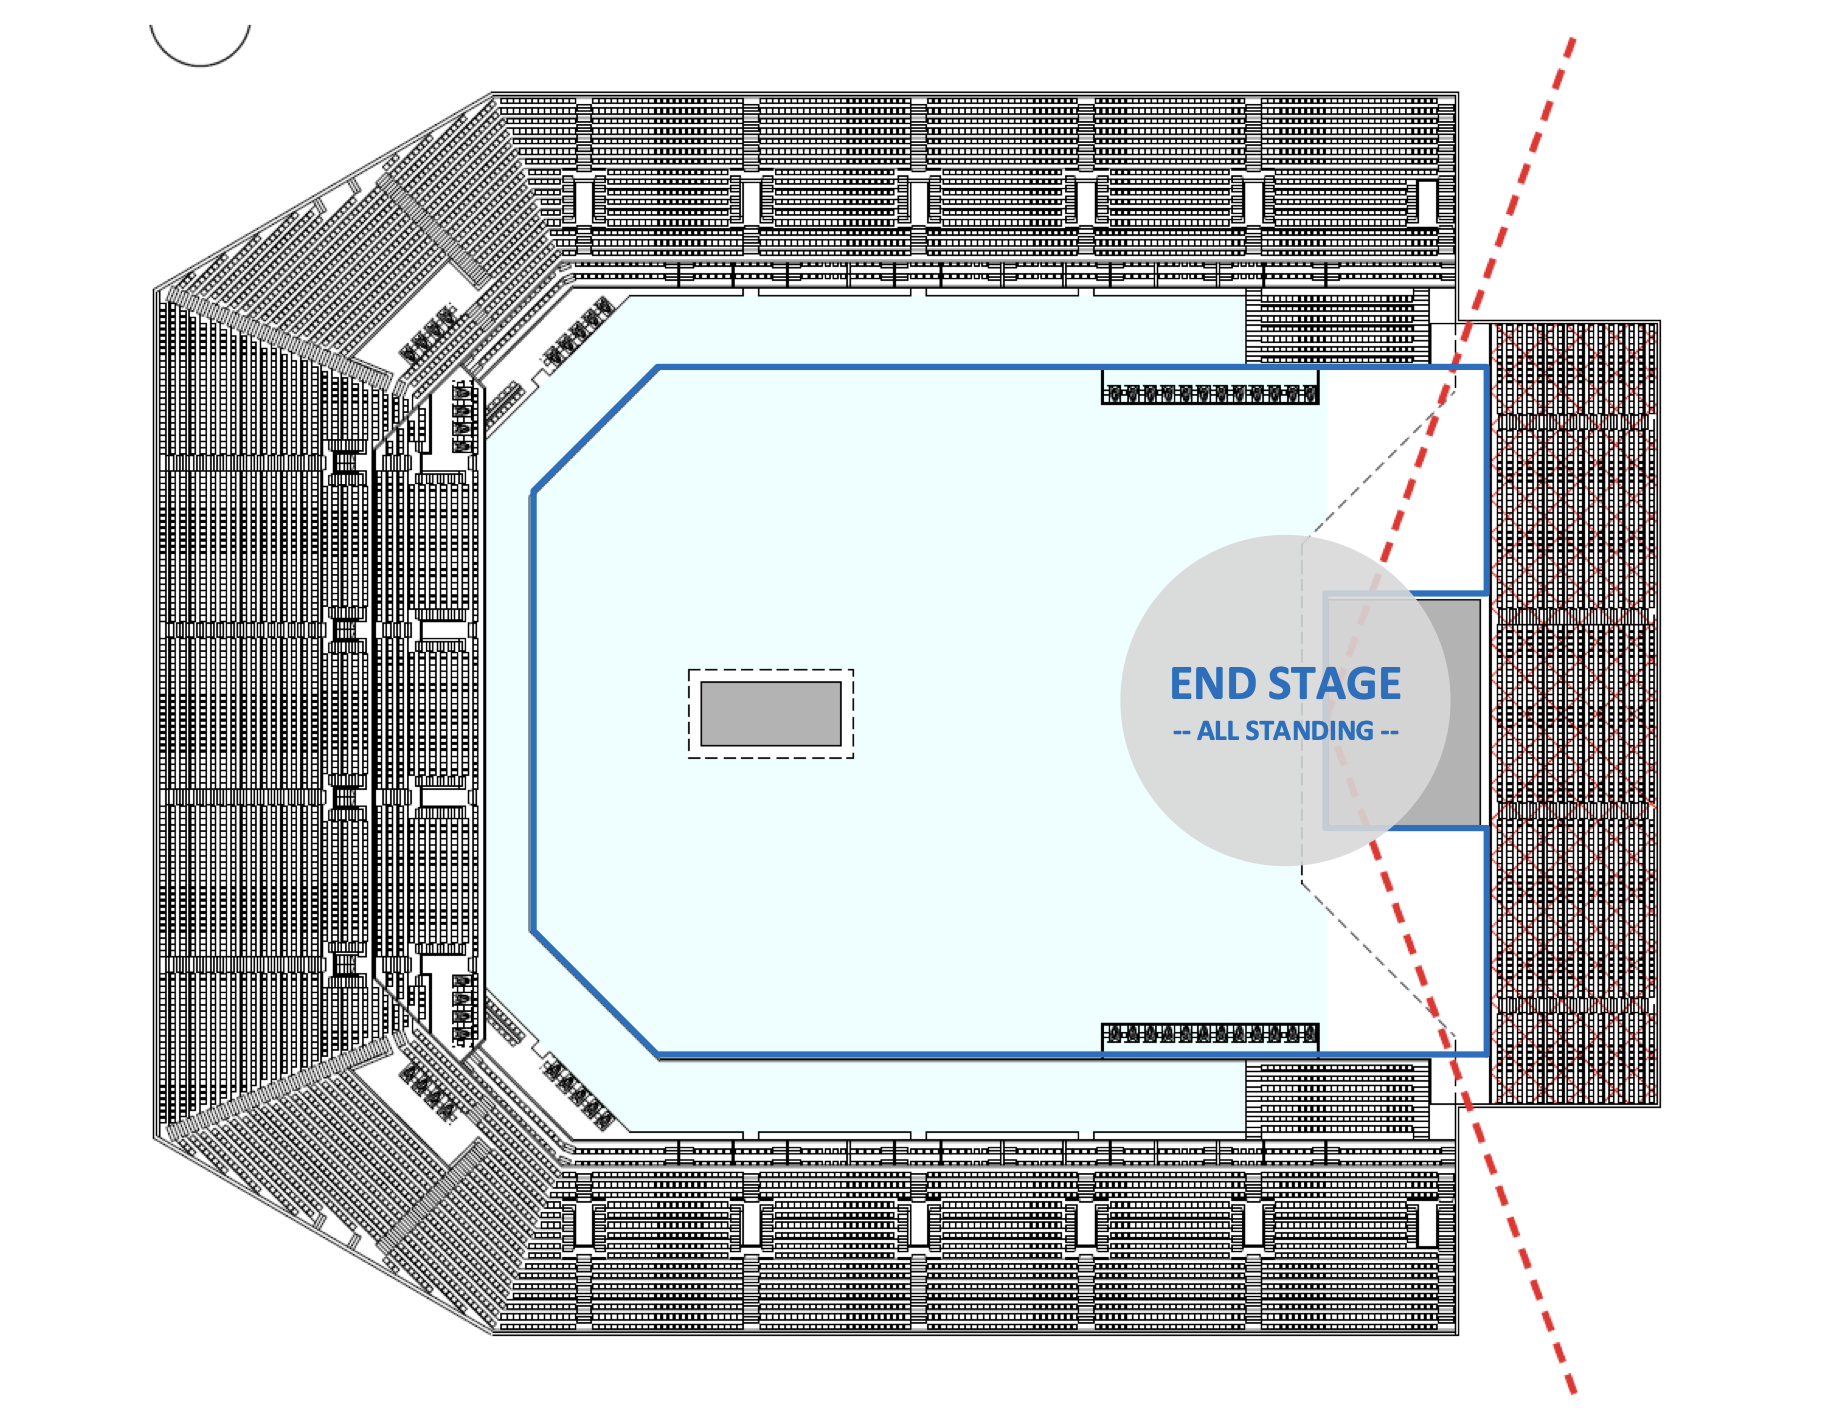
Figure 3 – End Stage Configuration
To identify coverage zones within the arena, each seating block was isolated and all would be serviced from an overhead position, with APs mounted off the gantry walkways.
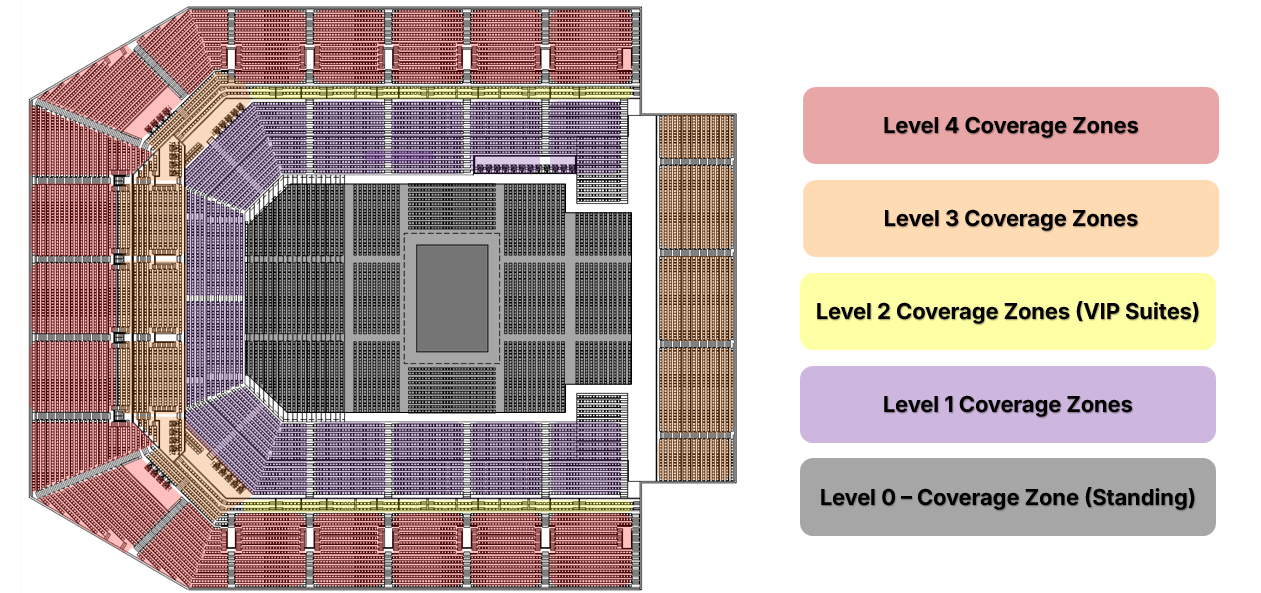
Figure 4 – Coverage Zones
Once cells were identified, an RF design was modelled in Ekahau AI Pro and Hamina to simulate coverage within the physical environment. For this project, the Cisco 9104 Stadium Antenna was selected. This AP has very tight side lobes, excellent receiver sensitivity and a self-contained enclosure.
The objective was set to ensure that the number of seats covered by a single radio did not exceed the maximum number of clients that needed to be catered for as part of the performance specification.
This AP can support up to 400 clients, with 200 on each radio interface. When designing, it was necessary to ensure that each cell did not exceed this number. This risk was mitigated by ensuring that each radio covered a cell of a maximum of 250 seats, which, given a take rate of 50%, would allow some headroom for any variance.
The 9104 AP has unique properties that allow beam switching and beam steering in software. Thus, coverage can be highly tuned from a fixed position. In addition, the AP’s orientation can be changed from landscape to portrait, which is excellent for creating separate cells for tiered seating blocks or for very dense areas, as shown in the following graphic.
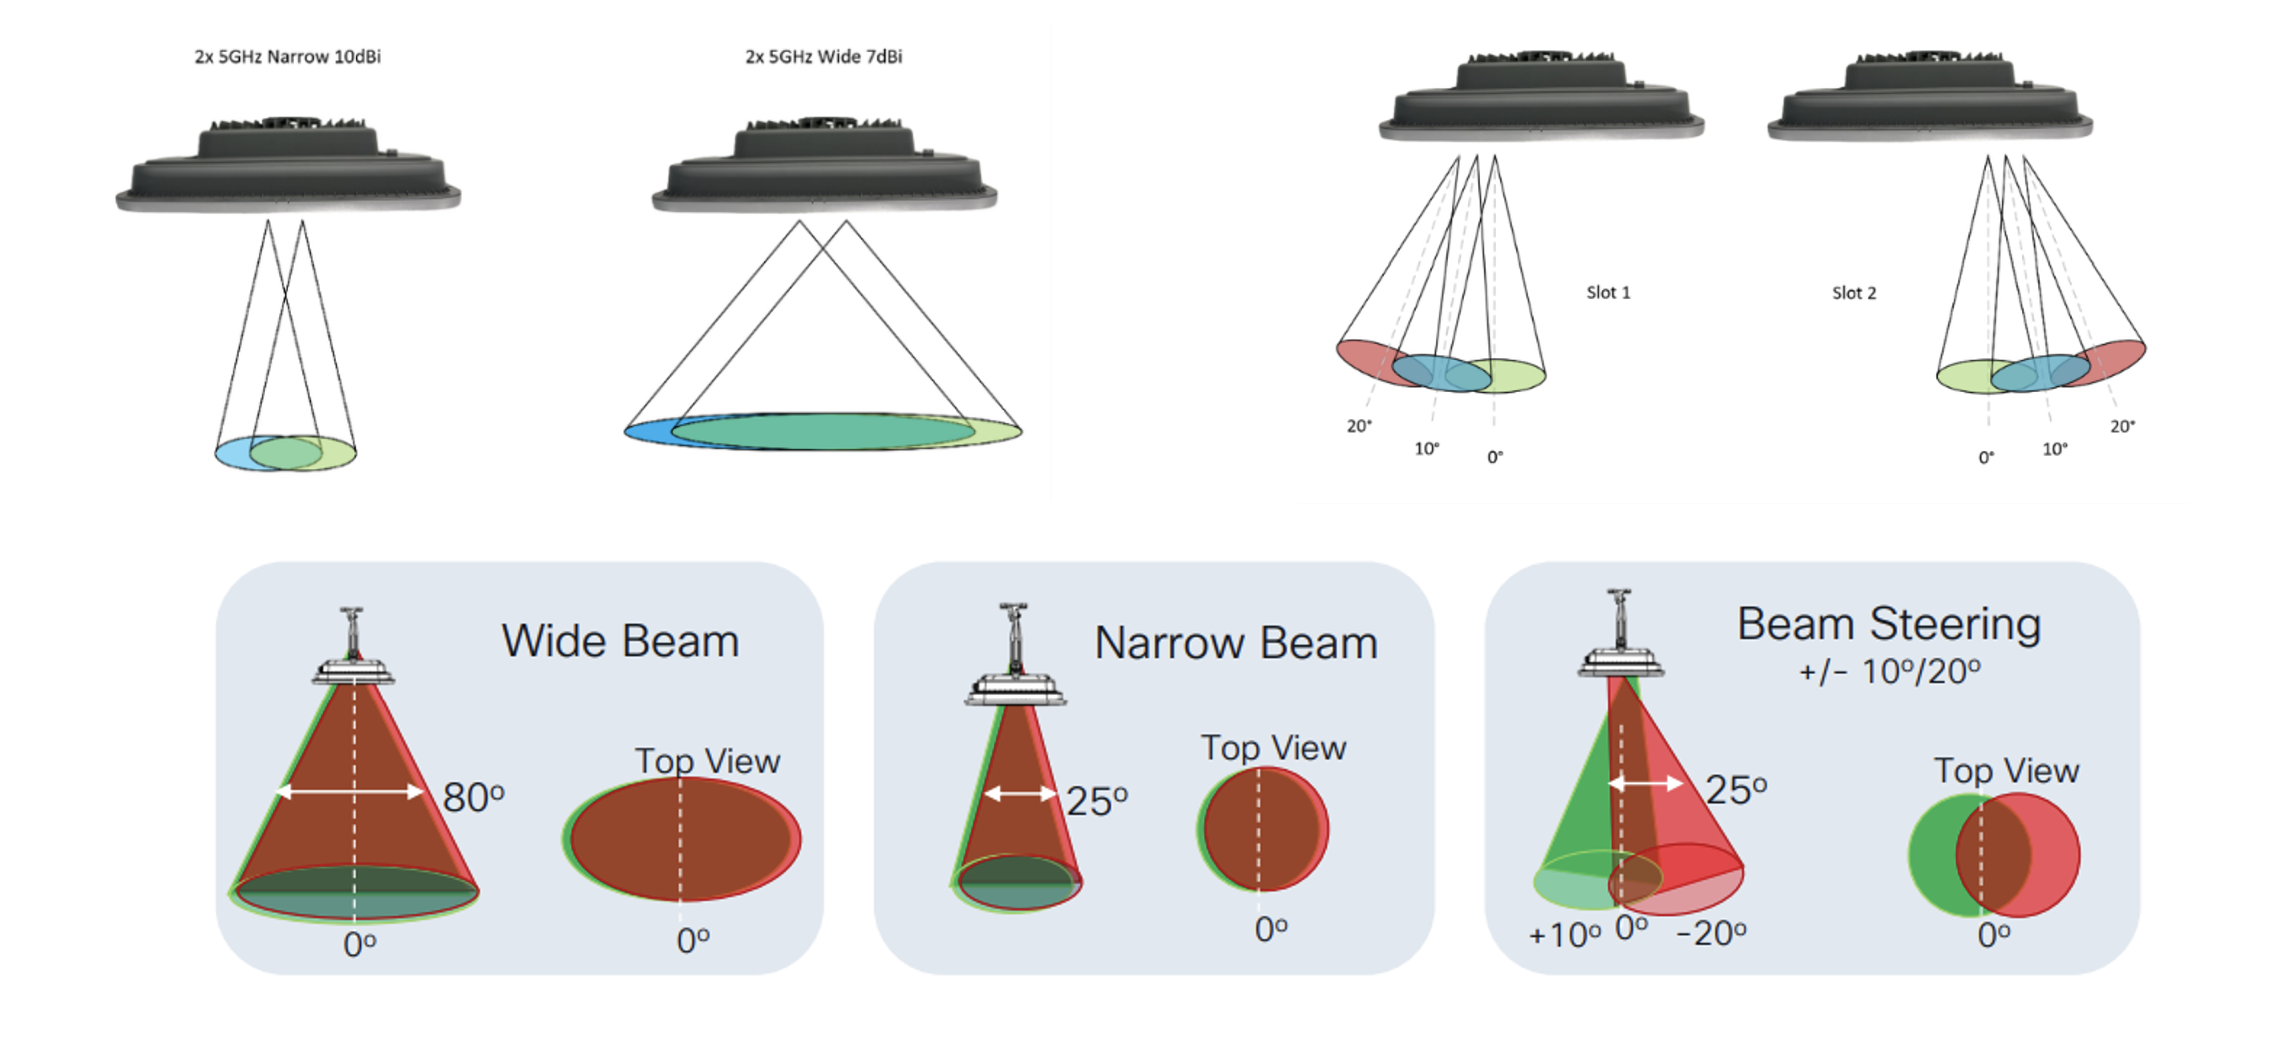
Figure 5 – Beam switching and beam steering configurations
No APoS testing was possible during this project due to a QuikDeck suspended from the roof structure blocking line of sight; as such, off-site testing was conducted to simulate the AP within a large physical environment to understand its RF characteristics.
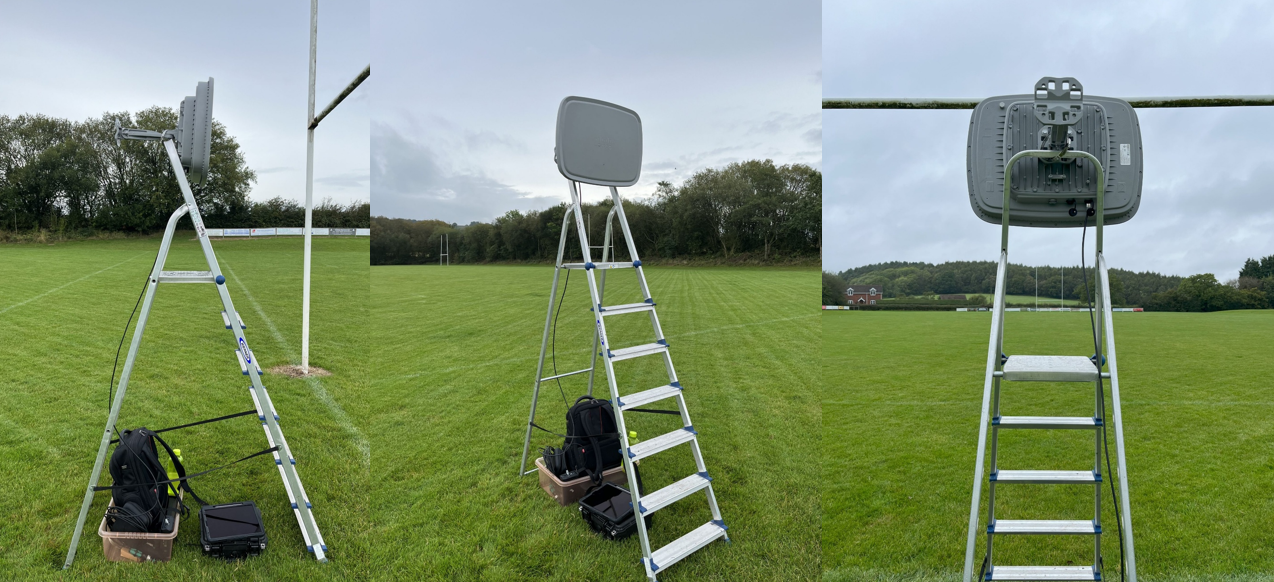
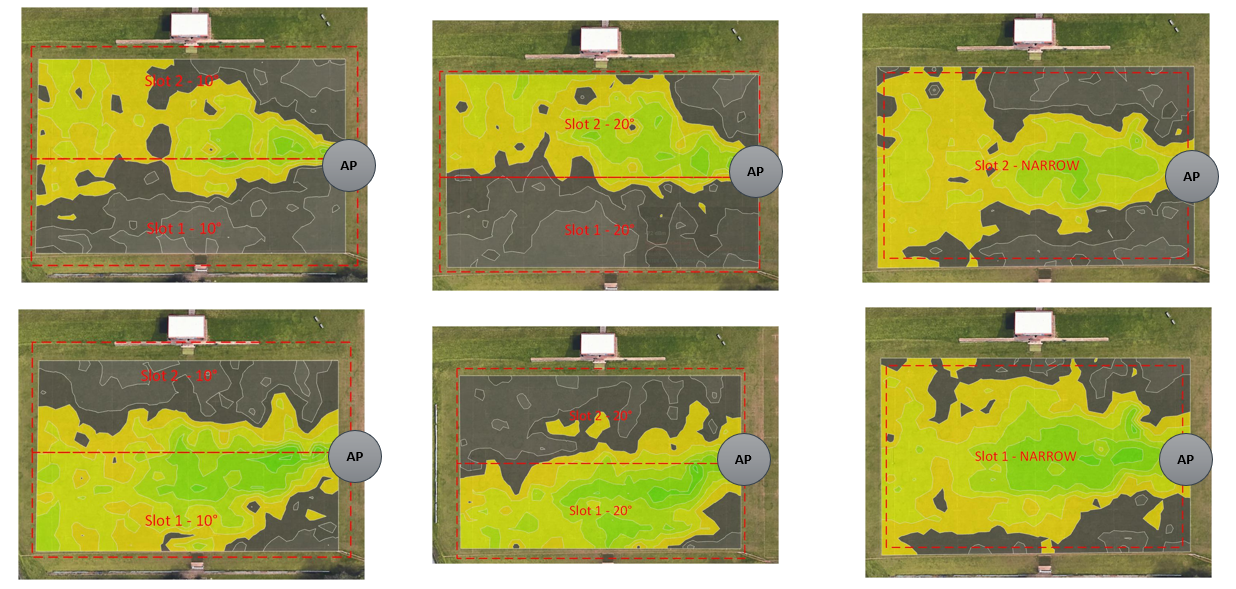
Figure 6 – Off-Site Testing
The AP was temporarily placed on one end of a rugby pitch, and the following walking path was repeated while testing different antenna configurations.
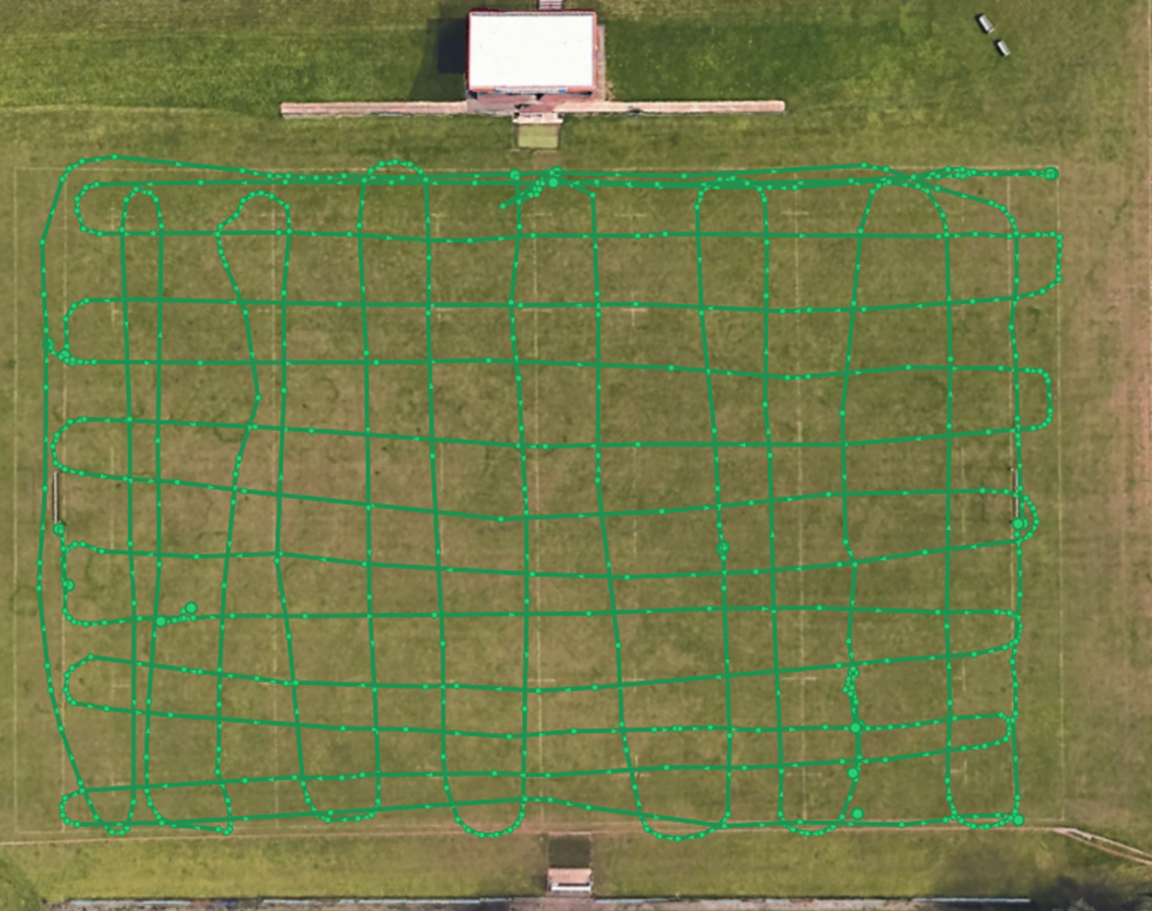
Figure 7 – Walking Path
The resulting heatmaps then allowed for some assurance to be given to the predictive design before physical installation.
Data collected from the off-site testing was then incorporated into the predictive model, and the resulting design was as follows:
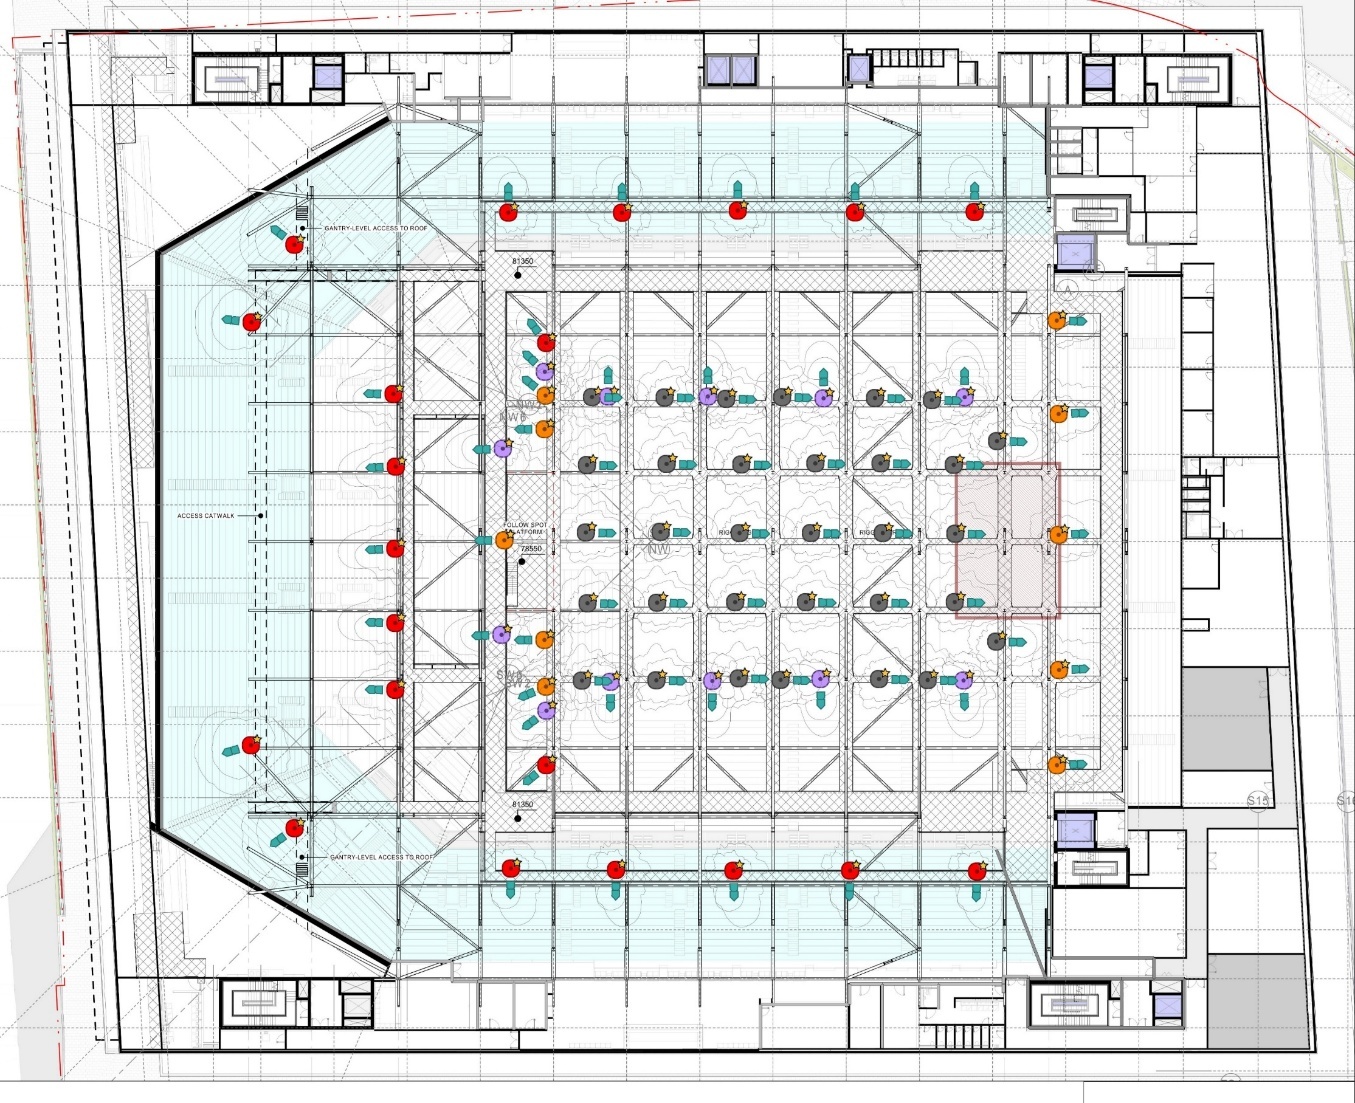
Figure 8 – Finalised Design in Ekahau
Once physically installed, the angle of adjustment was set according to the predictive model and confirmed on-site using a third-party app, Theodolite. This allowed for a visual reference point for the installer.
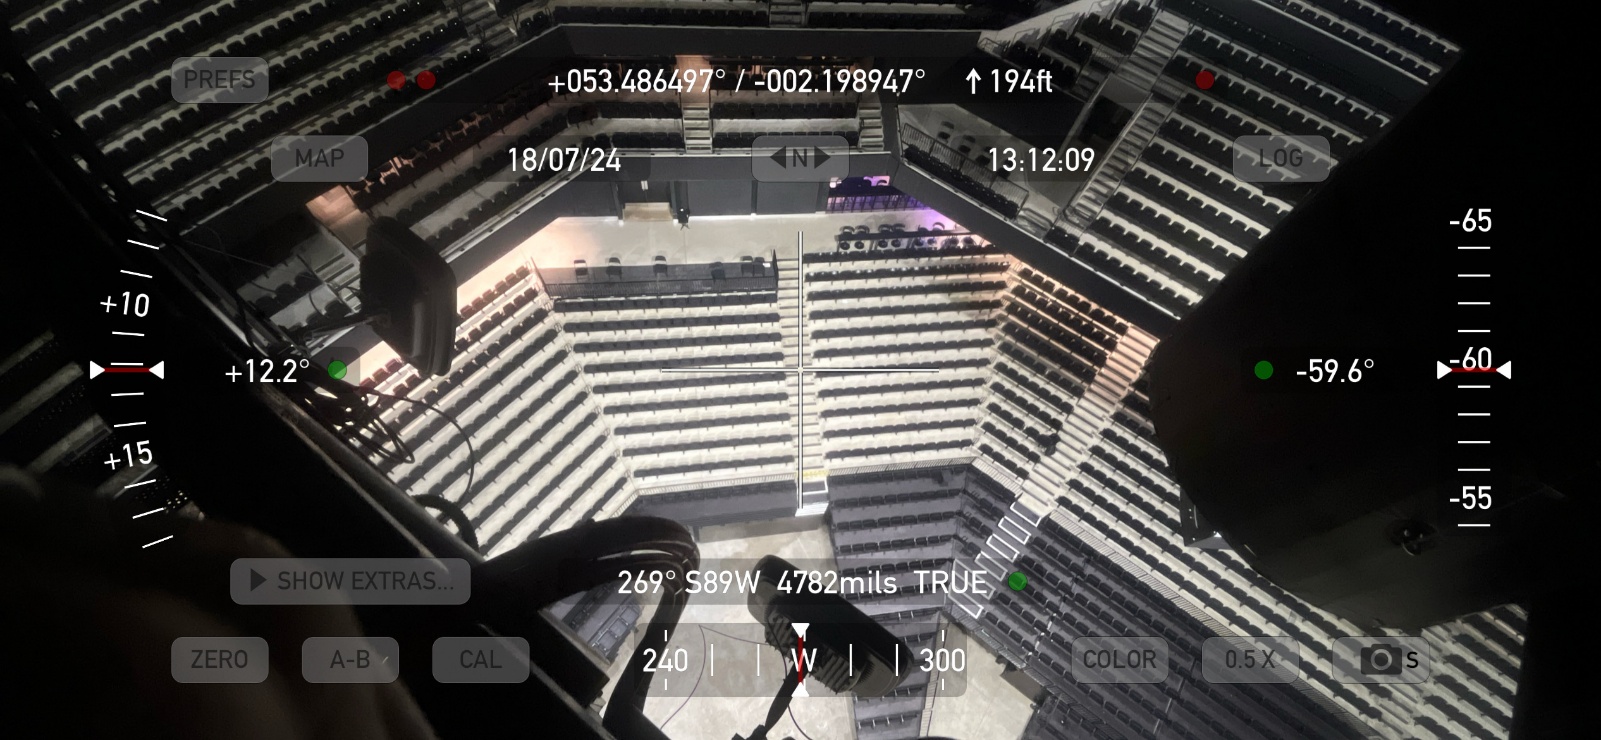
The resulting orientation (Landscape/Portrait Mode), slot and radio configuration was as follows:
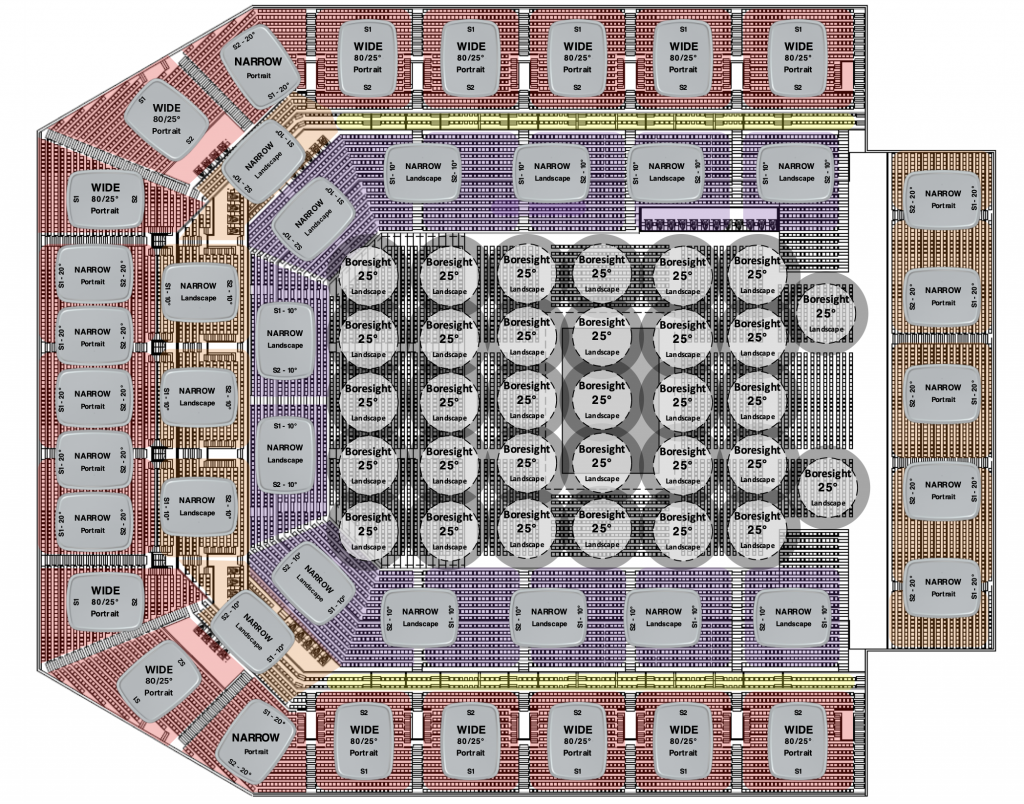
Figure 9 Cisco 9104 Orientation and Slot Configuration
TX power, and channels are hardcoded per slot to maximise spatial distance between APs and channel re-use, thus ensuring client load balancing across both radios.
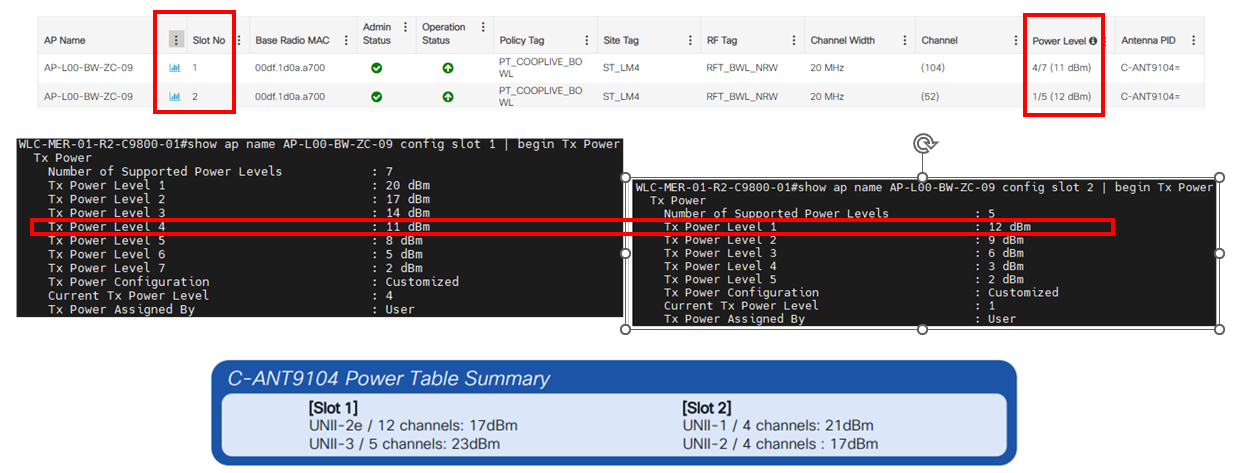
Figure 10 – TX Power for Client Balancing
To fine-tune the design, the whole bowl was subjected to a post-validation site survey.
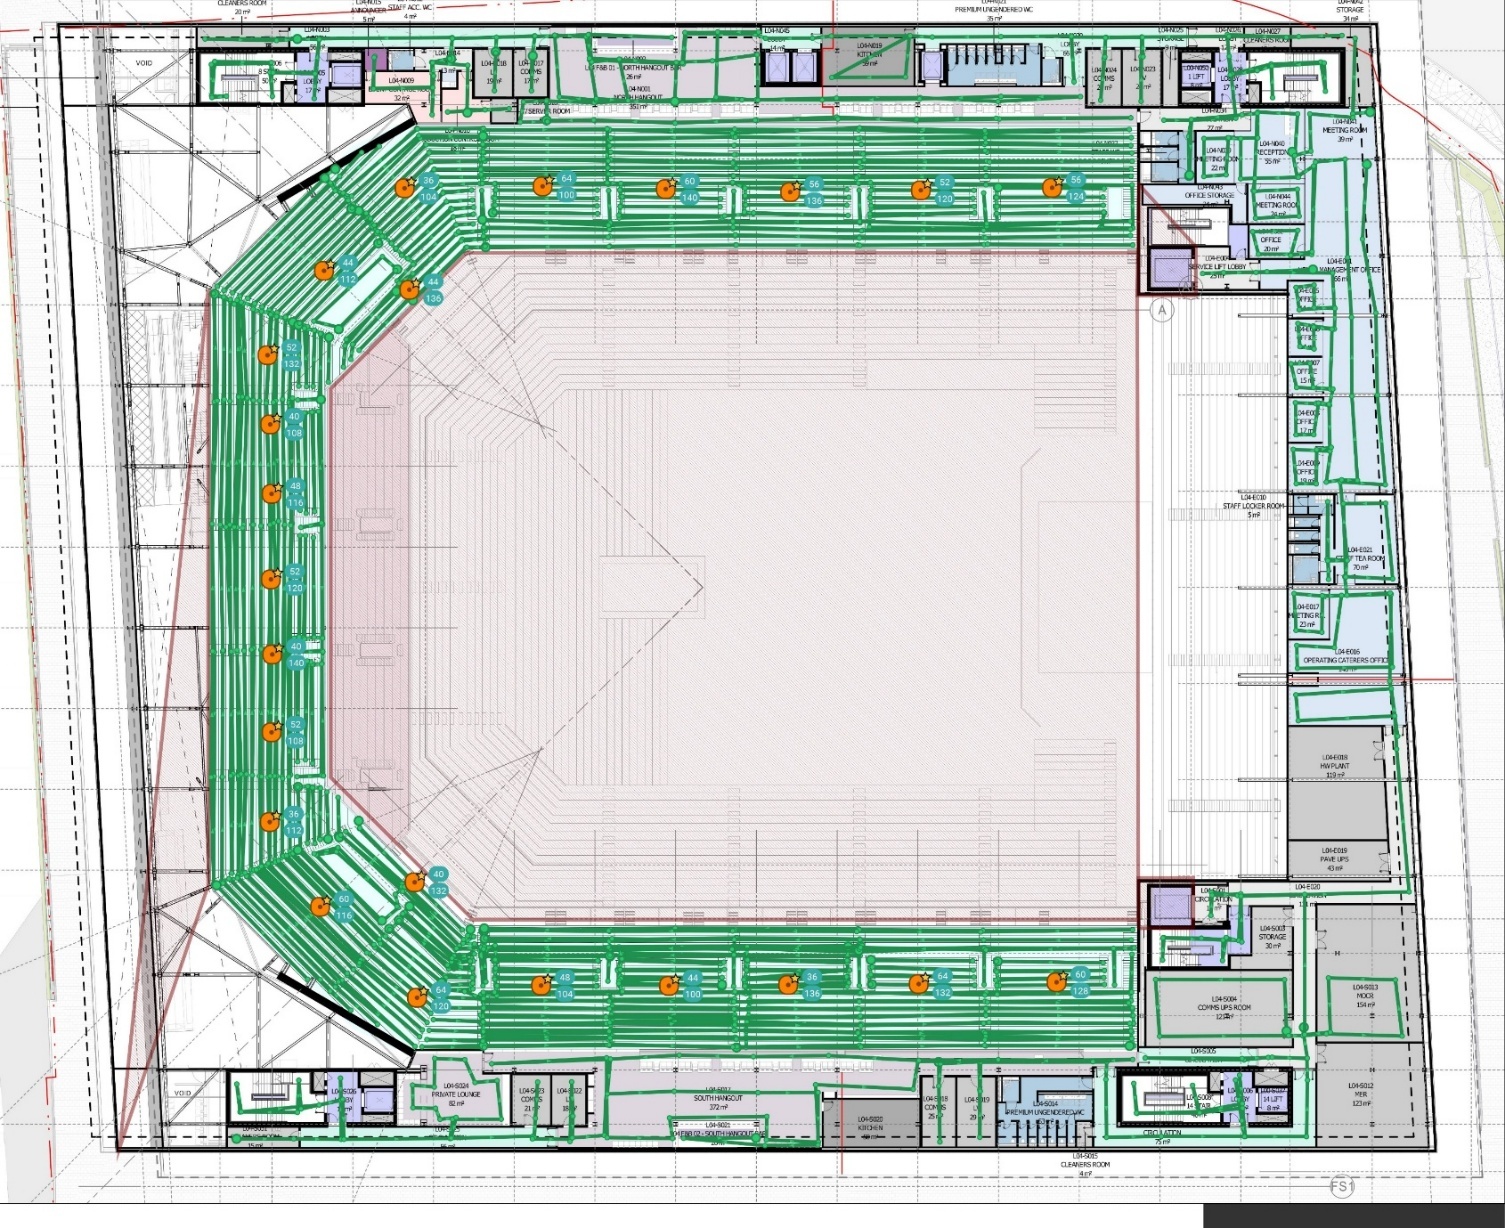
Figure 11 – Post-deployment Validation
In the absence of an APoS survey, multiple iterations of antenna configurations were tested to find the optimal coverage pattern for each cell/zone. This was visualised by splitting the radios in Ekahau AI Pro to view each slot individually.
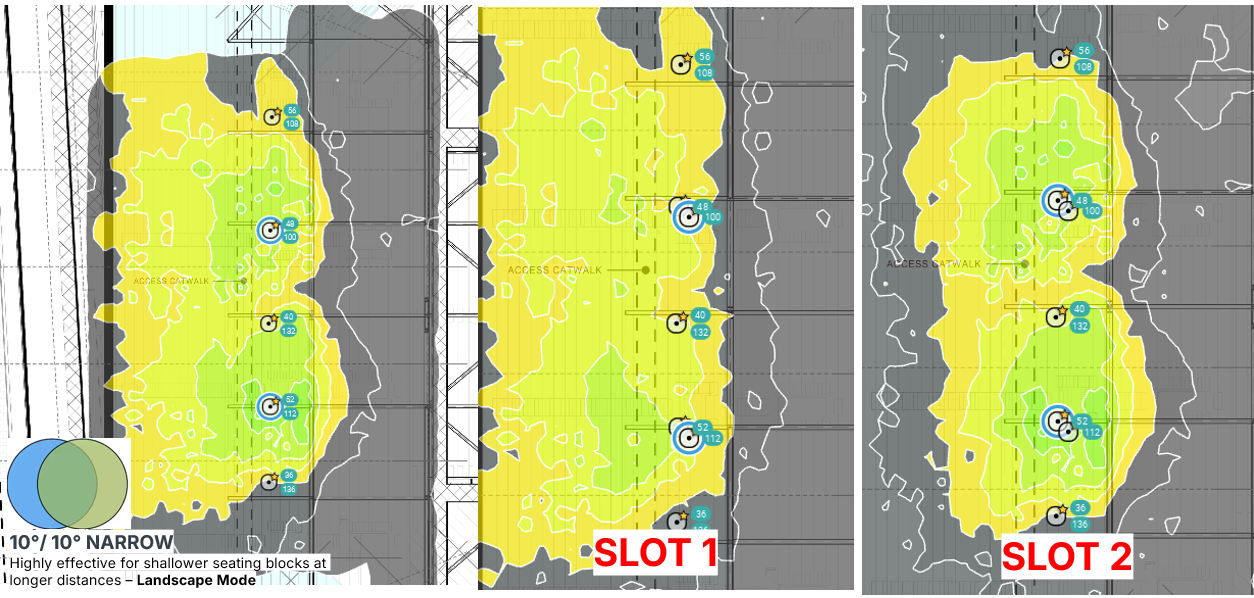
Figure 12 – Validation – 10/10 Narrow Beams
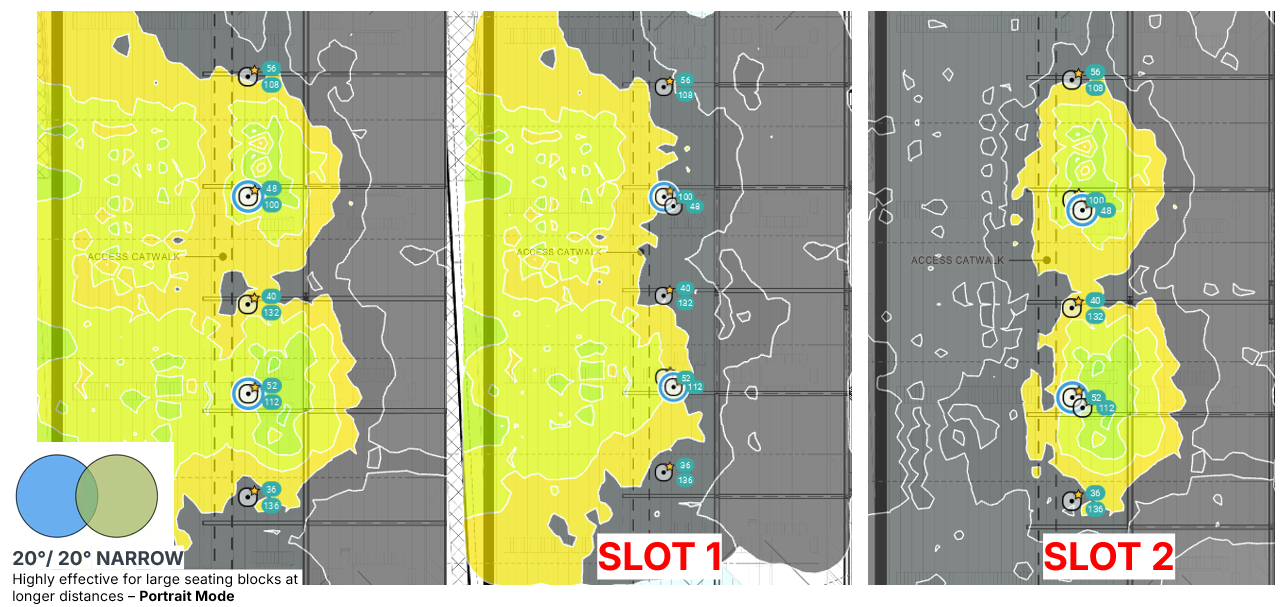
Figure 13 – Validation – 20/20 Narrow Beams
RX-SOP was used to limit the impact of co-channel contention due to the number of APs deployed.
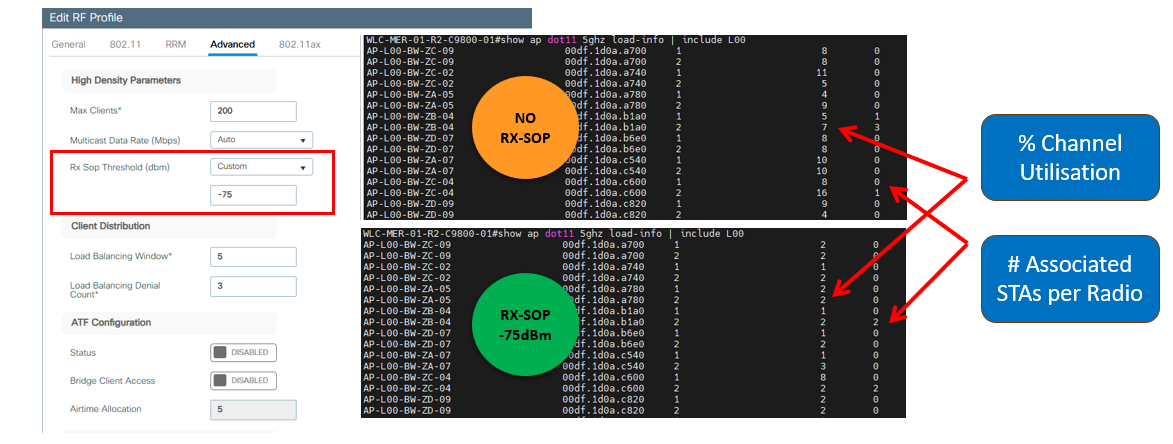
Figure 14 – RX-SOP Configuration
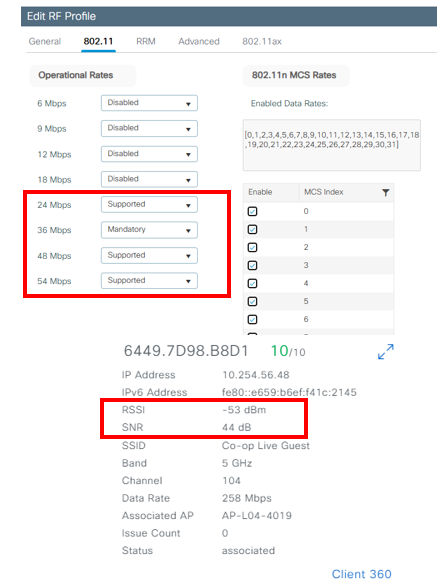
The minimum basic (Mandatory) data rates were also tuned to roughly define the cell size and work in combination with RX-SOP to maximise channel utilisation and airtime efficiency. Spot checks were carried out during live events to ensure clients could operate safely at these rates.
Once validation was completed, a final structural survey was completed, and the end result looked like this.