Introduction
I have long admired this product, and the wait to finally put it through its paces was a very exciting prospect.
Conceived during the covid era, out of a necessity to solve a number of challenges for deploying WiFi in large public venues, particularly overhead, at greater distances than traditional methods would allow, and in high density applications, whilst achieving similar channel re-use to that of proximity (Under seat) based designs. Which coincidentally is something I have become very familiar with over the past few years, as part of an ongoing project to commission a fan facing wireless network for the CoOp Live Arena in Manchester (Which is still in flight)
As fate would have it though, the original proximity-based design that I had planned to implement was now reimagined and switched to a purely overhead deployment, enter the C9104!
The capabilities of this product are generally well documented, but at a high level, it is formed of two components. The Cisco Catalyst 9130E Access Point (AP) and the C9104 antenna array, this is orderable through a dedicated SKU on Cisco.com C9130AXE-STA-E and sub level SKU C-ANT9104 This is assembled as complete unit at the factory, ready to be installed using a supplied, articulating mounting bracket.
Matt Swartz @ Cisco.com , who was heavily involved in creating the C9104 talks about it in detail on the Cisco Champion Radio Podcast
The Catalyst 9130E AP is directly attached to the C9104 antenna array using a DART-8 connector, In the 9130E, with modes such as dual 5G, 4×4 + 4×4 + (4×4 in 2.4 GHz), the older RP-TNC single RF connector was no longer practical. Cisco developed the DART-8 to simplify installations and to create a single insertion cable to go along with a new line of Self-Identifying Antennas (SIA) containing circuitry to automate provisioning and detection.
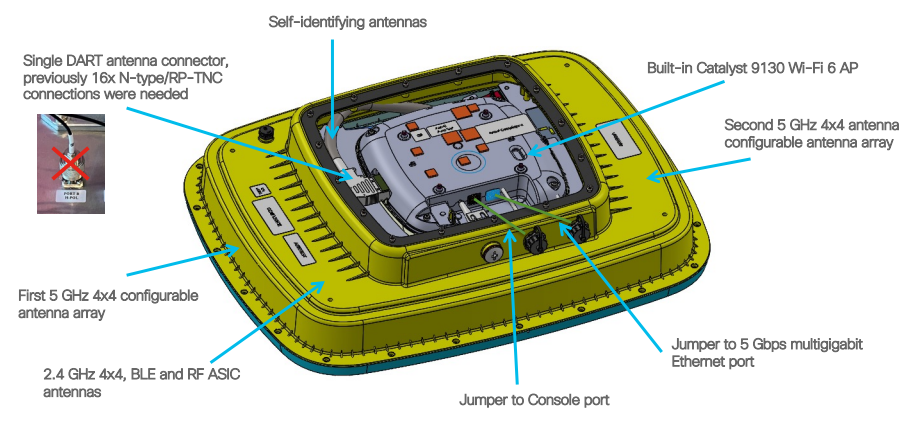
I won’t get into the specific capabilities of the Catalyst 9130 AP, but the datasheet is listed below for reference, essentially when released it was considered the flagship 802.11ax (WiFi 6) AP, but some would not consider this superseded by the newer 916x 6GHz models. Regardless, it’s still a powerhouse, and will be for a long time to come.
Cisco Catalyst 9130 Series Access Point Deployment Guide
Cisco 9104 Stadium Antenna – Capabilities
Key points to note about the C9140 Stadium Antenna
- Antenna Design Improvements – Cover Clients from Longer Distances (up to 200’ line-of-sight)
- Integrated Unit, Outdoor-Rated – AP + Antenna all-in-one, no enclosures required, outdoor-rated.
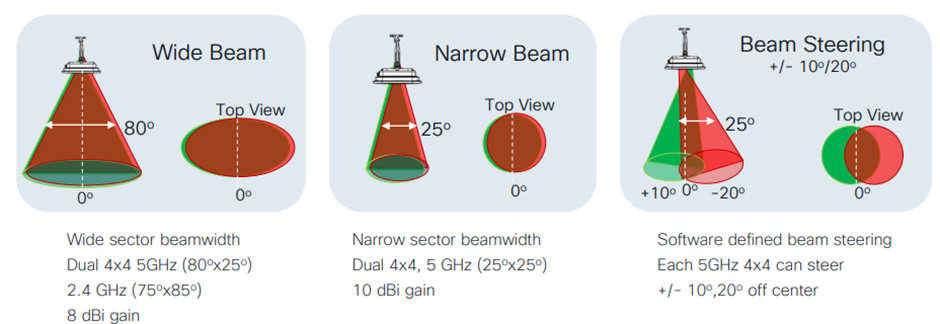
- Deployment Flexibility – Beam Switching & Beam Steering; switch between narrow/wide, meet needs of multiple different coverage types.
- Important Notes: Band-Locked Slots & Tx Power Implications Tight RF patterns, minimal sidelobes, RF Isolation = no RRM.
These are impressive claims in themselves, however what is most exciting is the ability to perform beam steering and beam switching, in software!
Jiri Brejcha @ Cisco made a great presentation on this topic at WiFi Design Day in 2021 to explain the practicalities of this, using umbrellas!
In essence, once physically installed, the engineer has the capability to modify the radio structure though software configuration to achieve different coverage profiles, this in itself is extremely power, regardless of the fact that the receiver sensitivity of the antenna has been documented to achieve a very good user experience at distances of 50m+.
Before we get into the purpose of the article though, it is also important to note that how the C9104 is physically installed Is extremely important in terms of the intended coverage profile, and the throw that can be achieved between AP and associated stations.
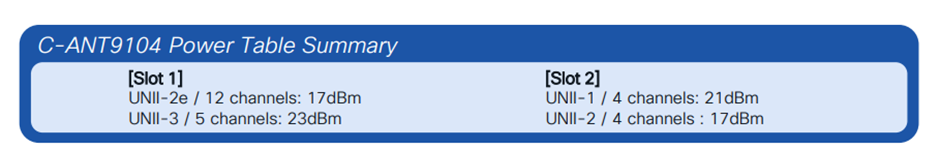
The C9104/9130E combo has x3 radios. 2.4Ghz (Slot 0) 5GHz (Slot 1) and 5GHz (Slot 2) which is important, as these radios are band locked, as such you can only configure a specific subset of channels on each radio, and thus maximum transmit (TX) differs as you go through the various UNII bands.
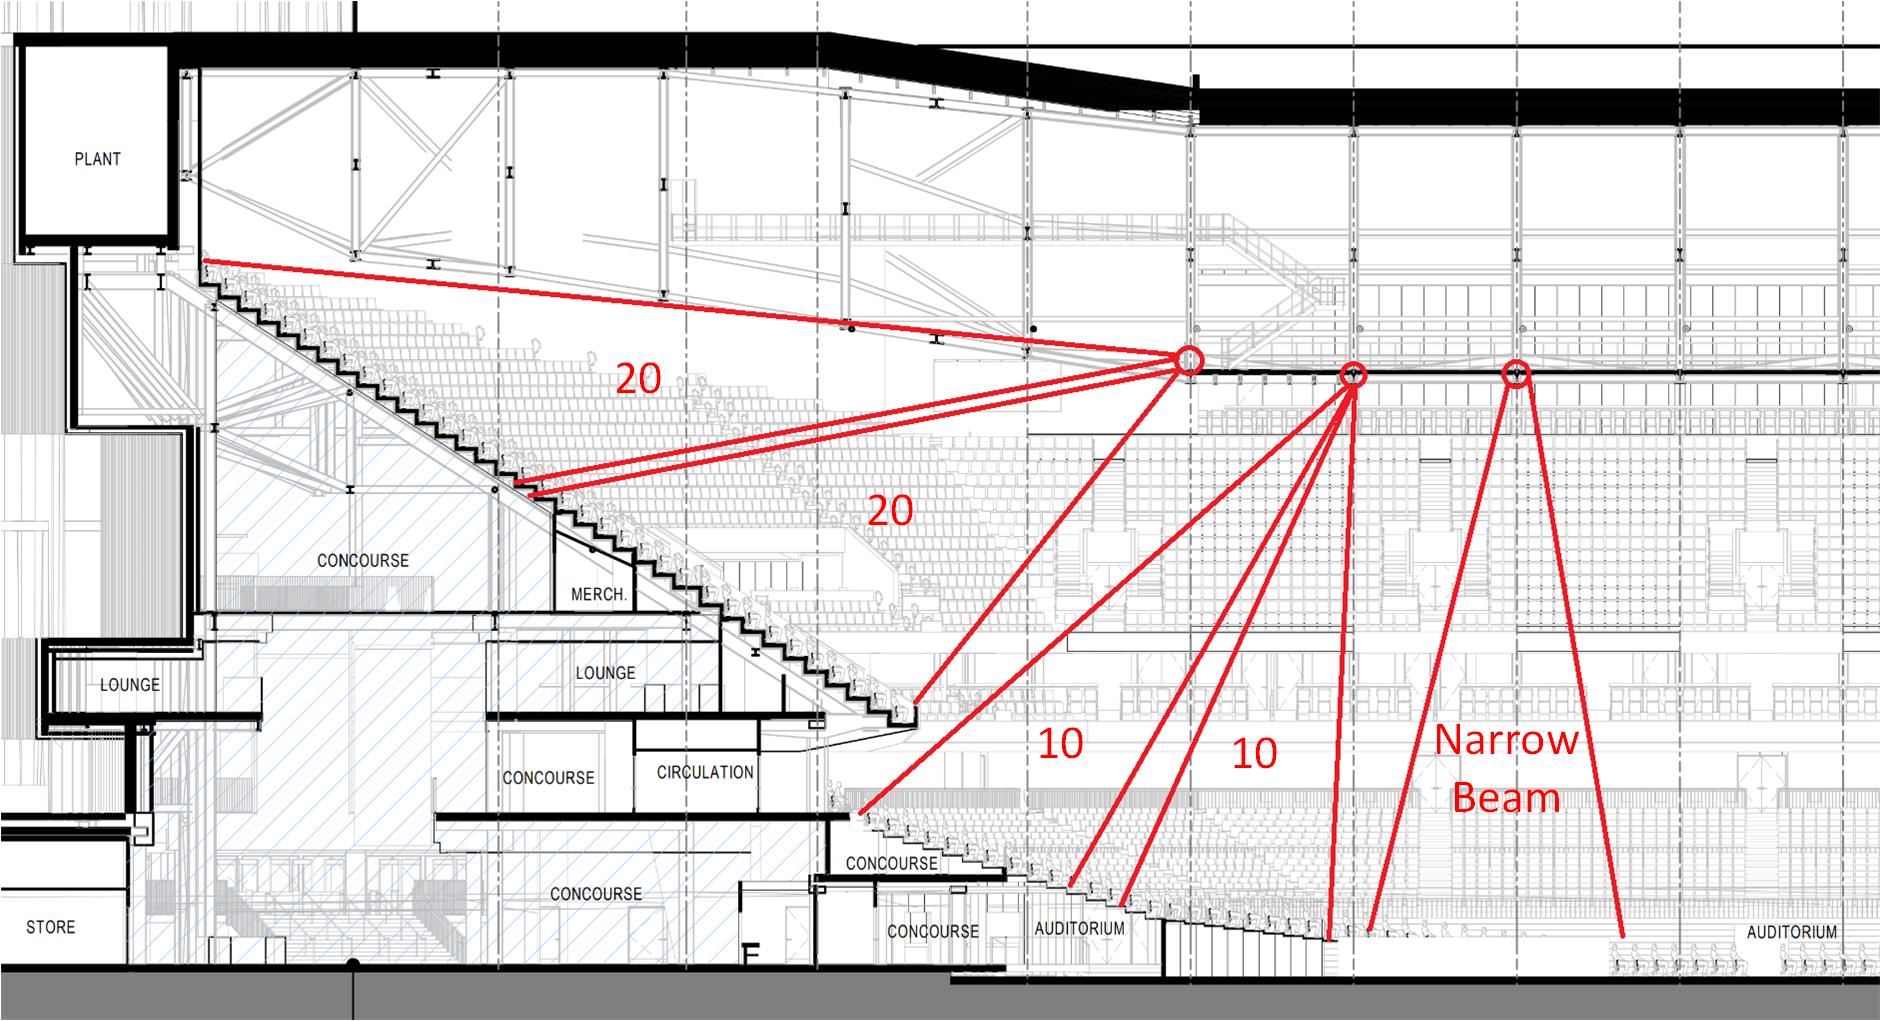
When installed in what is referred to as “Landscape” mode ie: the longest edge of the AP is perpendicular to the floor/coverage area, it isn’t as much of a concern, however there is a second mode of operations “Portrait” where the AP is flipped onto its shortage edge, in this configuration it is important to note how Slot 1 or Slot 2 is orientated as it will have a direct impact on the coverage profile, especially for one particular scenario requiring the AP to cover tired seating within a venue.
The example below denotes how the AP could be configured with different beamwidths on each slot to split coverage between two areas from a single position, however the AP would need to be oriented in portrait mode and SLOT 2 biased towards the lower seating tier and configured with higher TX power (Assuming that you’re in a regulatory domain/country where UNII-3 channels are still not available)
Back to the point, as previously mentioned, a design for CoOp Live had already been completed, to achieve the required density, this consisted of 285 Cisco Catalyst 9120AXI APs being installed in Oberon IP67 rated enclosures under customer seating within the bleachers, hence the term “Proximity” design, the nature of which relies on human bodies to attenuate RF signals to the point where an acceptable level of channel reuse is possible and thus an achievable percentage of capacity.
Due to extenuating circumstances, this design has now been reconsidered and replaced with a purely overhead design using the C9104 stadium antennas affixed to an existing gantry platform that sits 25m above the main arena floor. It is fortunate that this gantry exists as it provides a perfect platform on which to attach the C9104.
Unfortunately, this design cannot yet be shared in the public domain, as it is client confidential, but hope to release it closer to project completion, as it raises a number of interesting discussion points, what I can say though is that x285 9120AXI APs have been collapsed back into x75 C9104 Stadium Antennas (150 Radio Interfaces) half of which was originally proposed in the under-seat design.
There is some good reasoning behind this, namely access to facts and figures shared from venues of similar size operated by the client which gives a relatively deterministic view in terms of expected take rate before and during a live performance, however total occupancy of the venue is in the region of 25-30,000.
As with any design though, validation is key, and any opportunity to better understand the physical characteristics of a particular apparatus is critical for success of the project, this is especially true when working with high density designs.
I know the rated capabilities of the product, but how do I test this for myself, prior to being able to conduct APoS testing within the venue itself.
The Test Setup
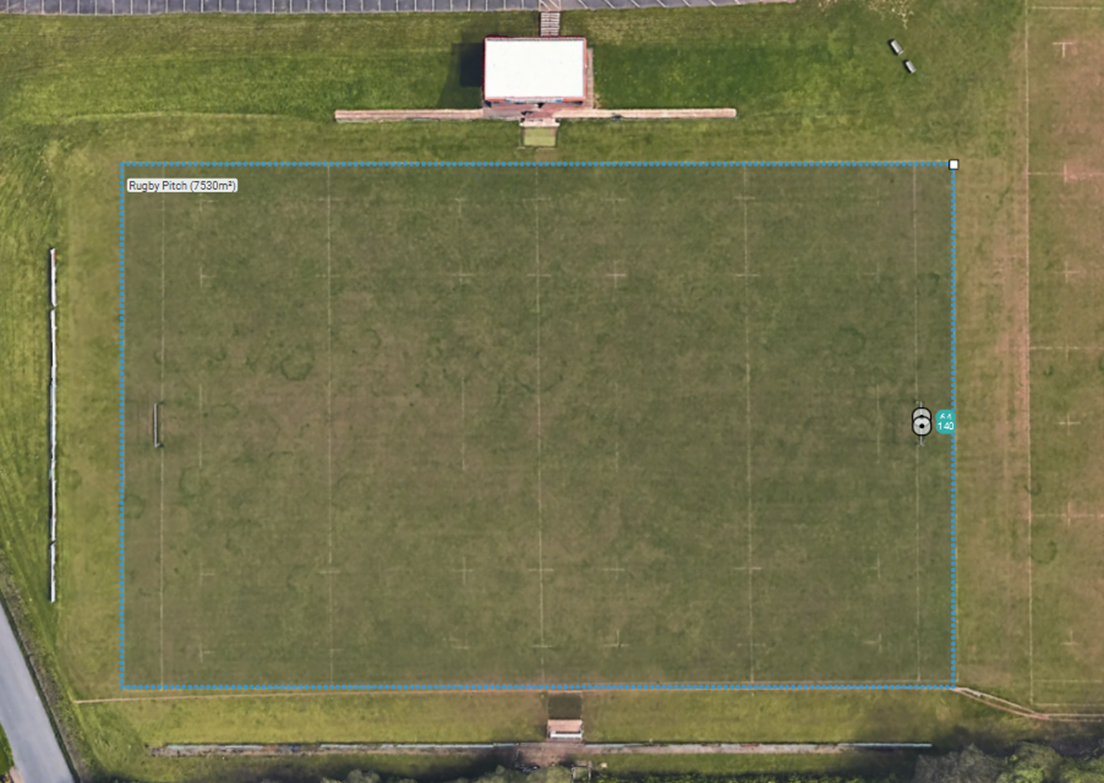
Well, it so happens I have access to a local rugby club, and their 1st XI pitch, for those not familiar with the dimensions, a pitch is typically within a range of 7,208-10,080 sq m and as an added bonus is clearly marked at regularly intervals to note specific area of the pitch, which are used during games, these markings are extremely useful for orientating yourself when conducting an APoS survey. A segway would have been incredible useful in these circumstances but alas, good old leg work would have to come into play…better start walking!
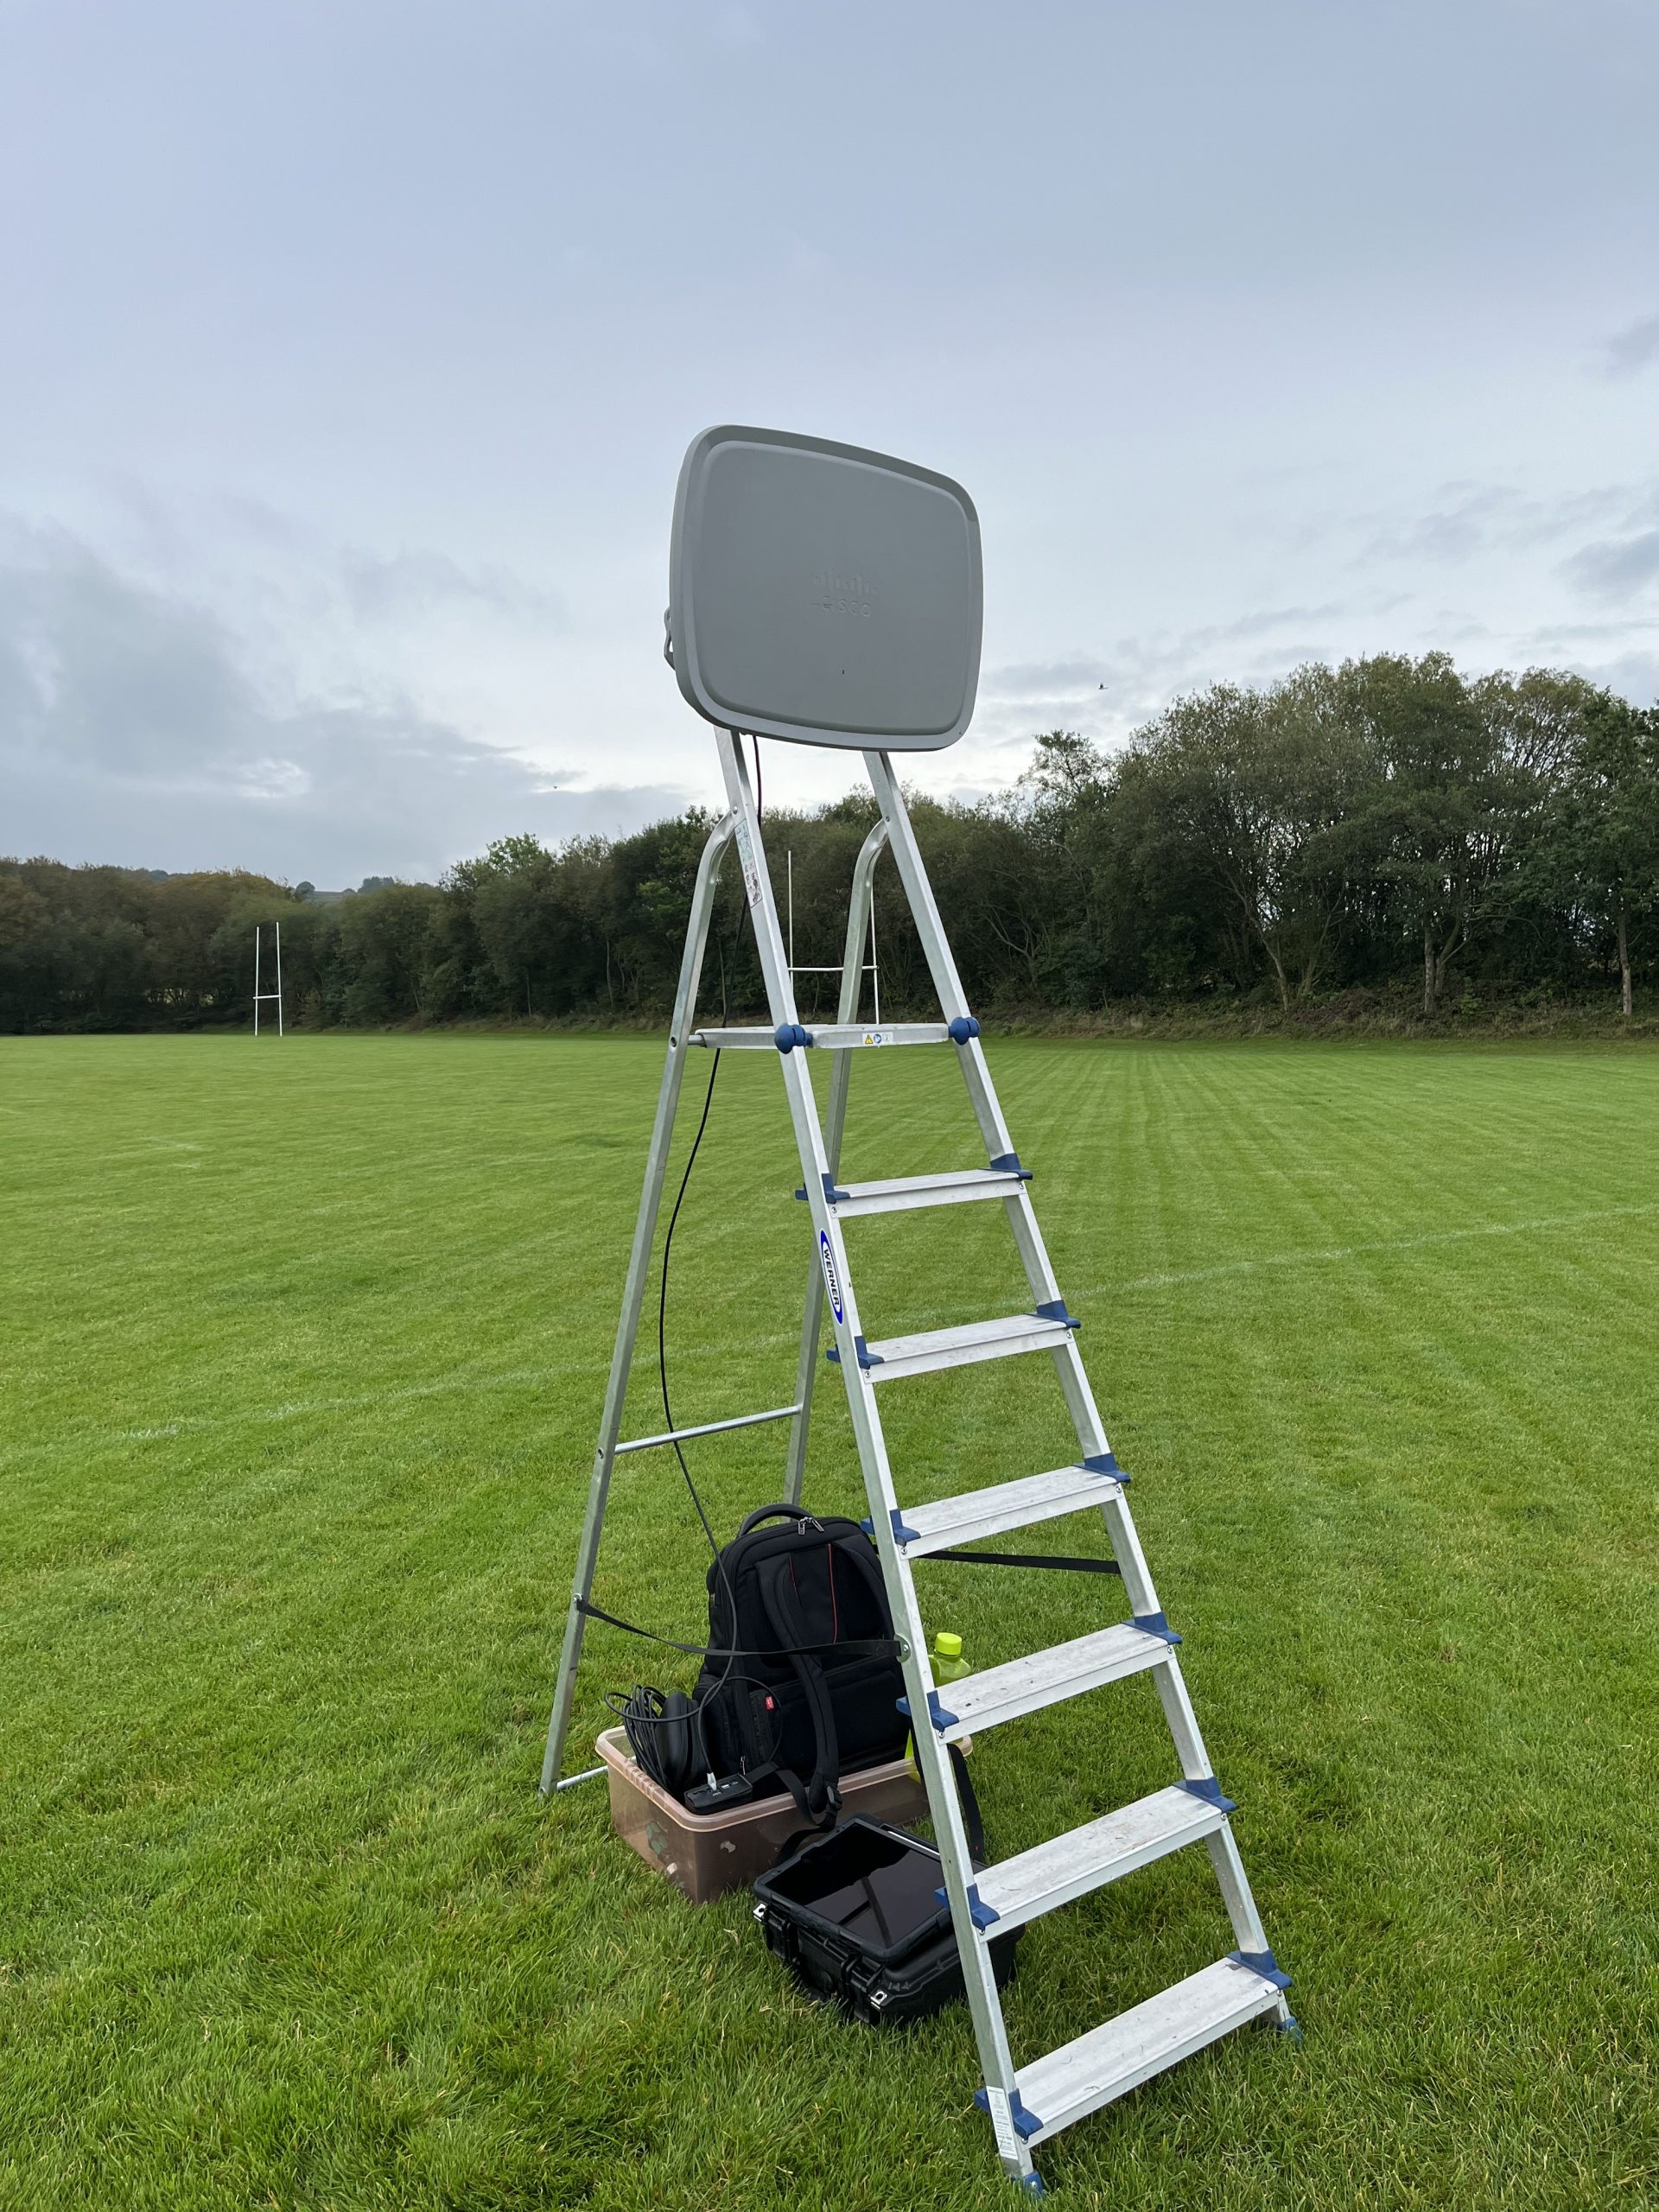
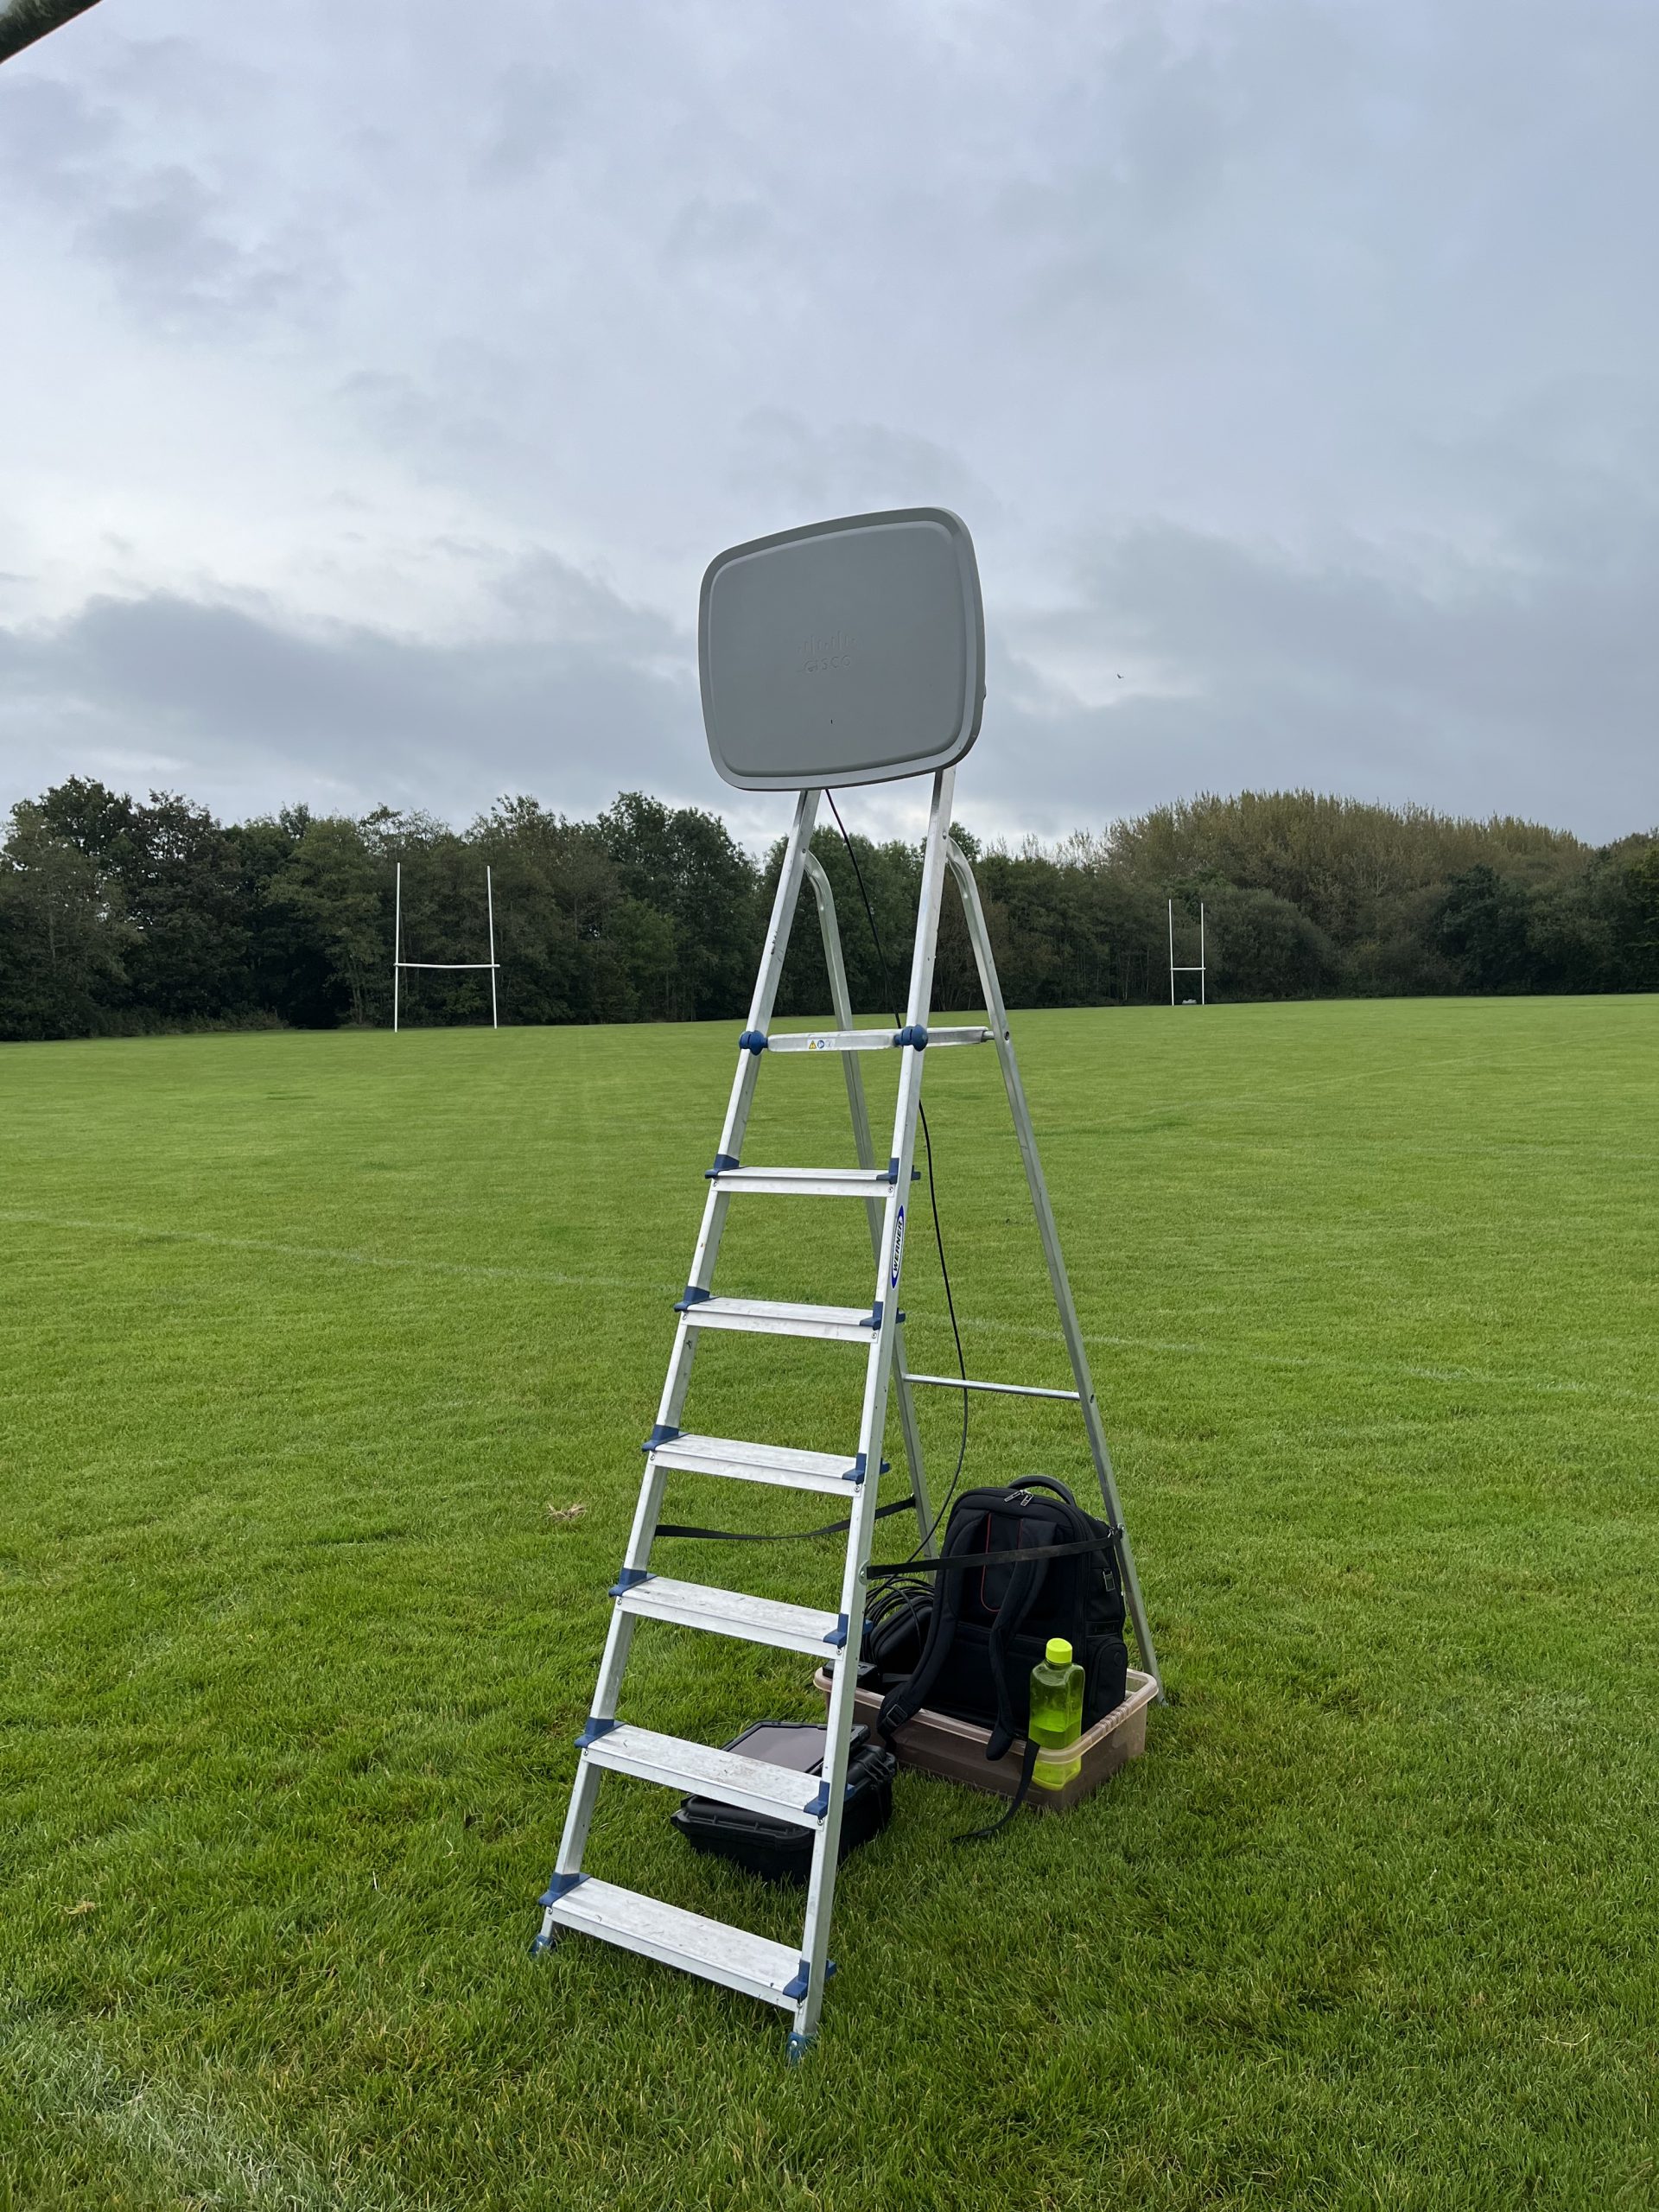
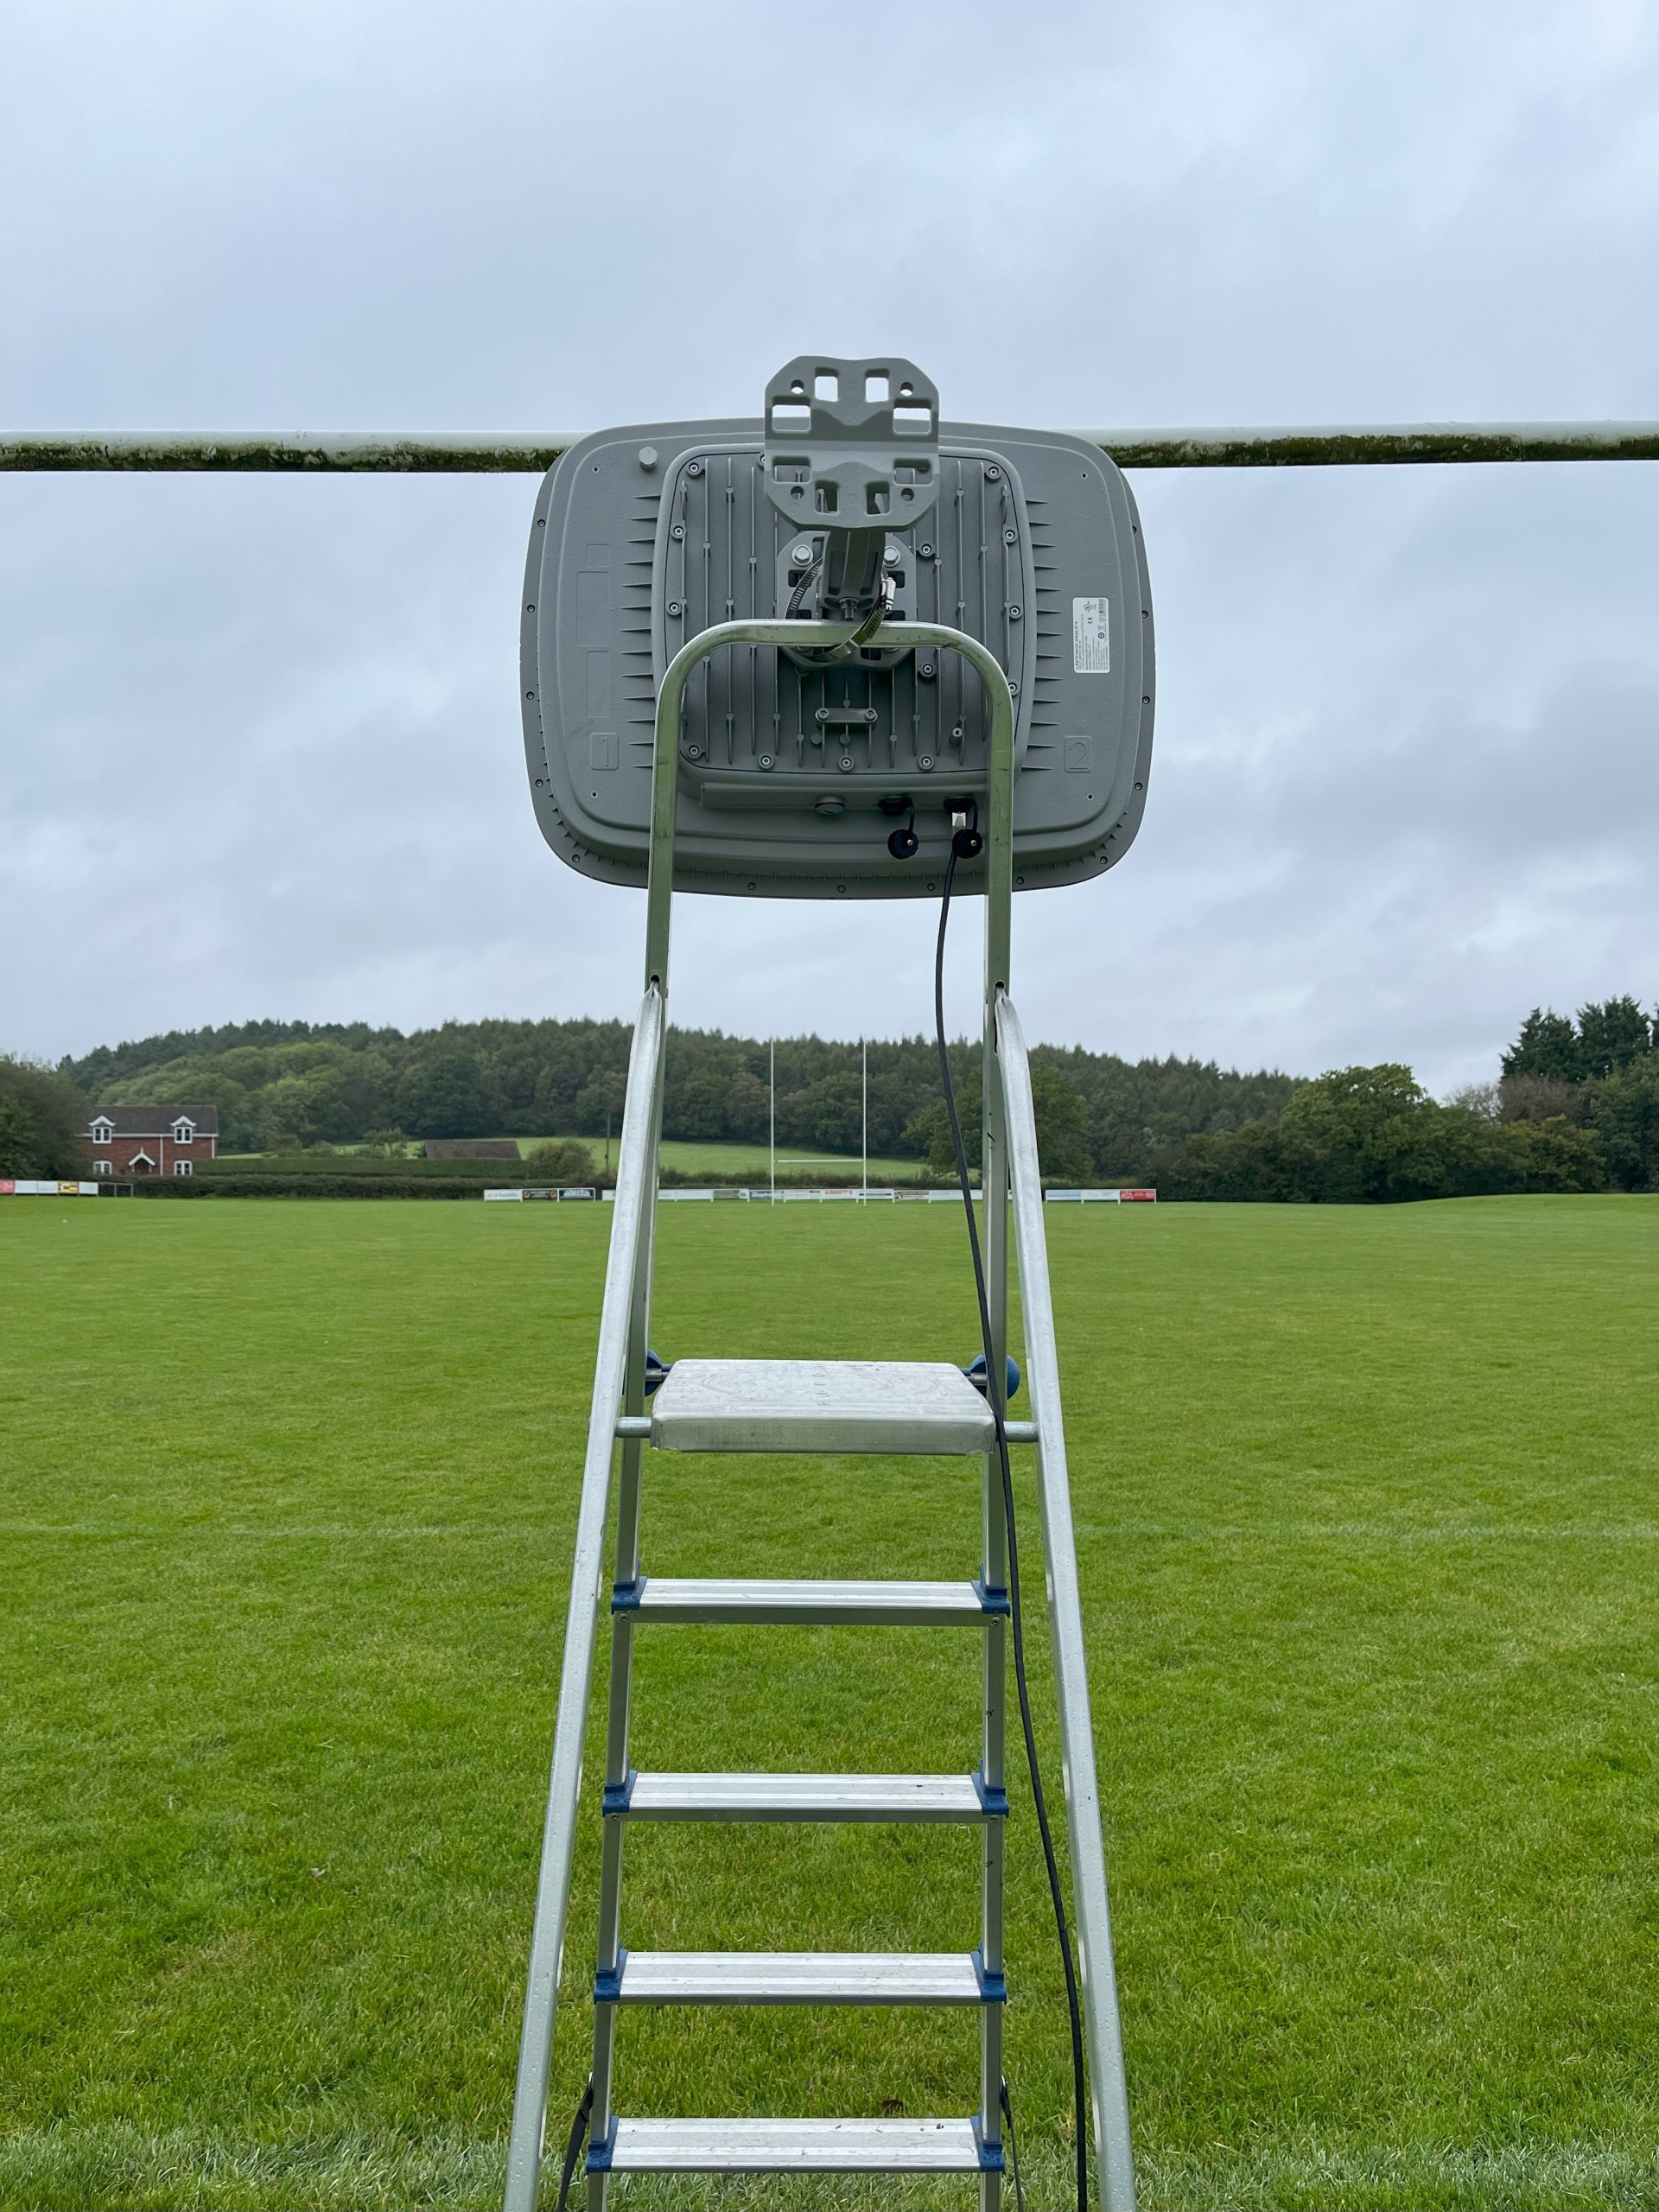
To get a more rounded option in terms of the C9104’s capabilities and real-world performance in free space, i first positioned the C9104 at one end of the pitch in between the goal posts, and to coin a phrase used by Tom Hogan @ Vantagepoint, conducted an APoL (AP on Ladder) survey. The AP was affixed to the ladder on a -5 degree angle approximately 2.5m above ground level. Agree, this isn’t typically where you would normally situate this particular apparatus but wasn’t permitted to mount it higher on top of the goal posts, which was the original idea, still I believe it would allow me to get a good understanding of the propagation characterises and do some rudimentary client testing.
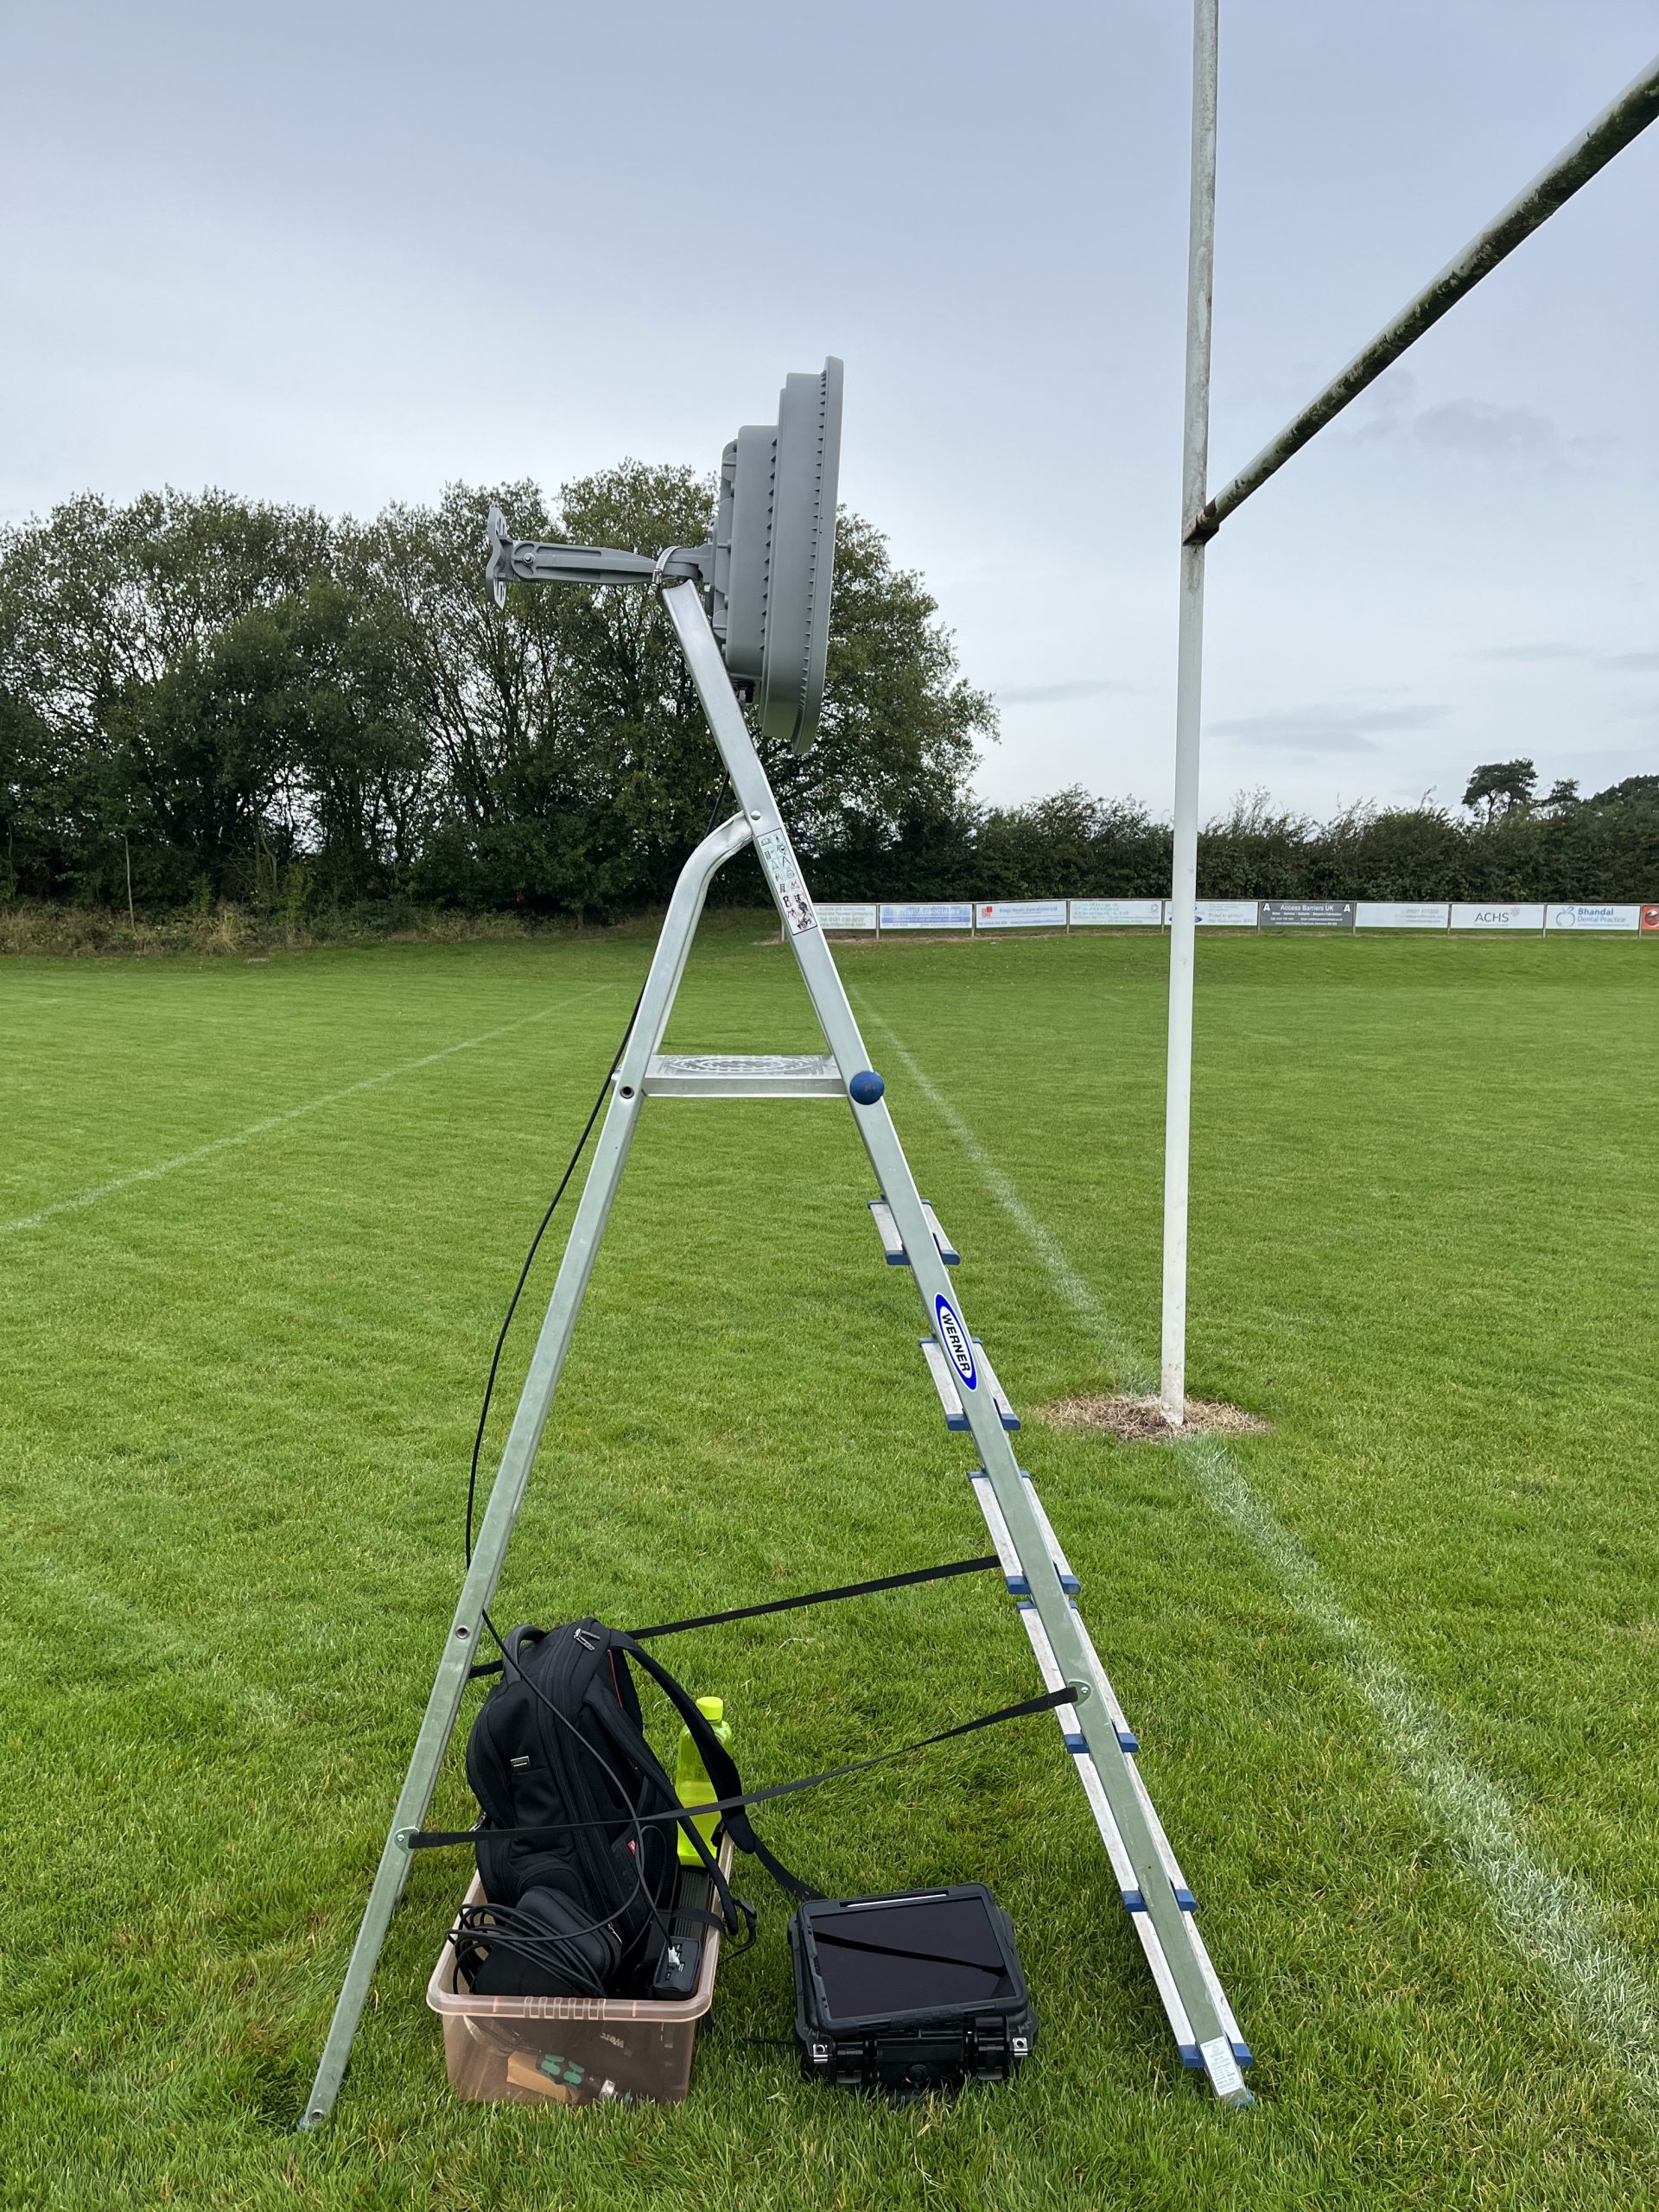
This test was focussed on 5GHz only, as for this application within the venue, 2.4GHz isn’t considered and will be disabled on all APs.
It is also assumed that the vast majority of STAs that will associate to the wireless network will be personal electronic devices (PEDs) such as mobile phones or tablets.
The measurement tools used for this test are:
- Ekahau AI Pro v11.4.0.1
- Apple iPad Pro 5th Generation (iPadOS 16.6.1)
- Ehahau Site Survey Pro on iPad v2.7.367
- Acceltex Accelerator Battery Pack v2
- Ekahau SideKick v1
- WLANPi R4
Test Methodology
What I wanted to achieve was:
- Validate functional operation of beam steering and beam switching through modification of radio structure (Radio Profiles)
- Validate FSPL performance over long distances, upto 100m from the transmitter and attempt to verify receiver sensitivity at both the AP and a typical personal electronic device (PED)
- Validate the effective, usable range of the C9104 to meet minimum requirements for RSSI/SNR to support an acceptable quality of experience for a typical personal electronic device (PED)
The radio configuration that was used across the various tests is below:
NB: RRM does not work on the C9104, as the sidelobes are very tight and as such NDP doesn’t function ie: the protocol used by APs to discover RF neighborships.
NB: Channels must be configured manually and have a direct impact on the maximum configurable TX power within each UNII band, by default the C9104 uses the maximum TX power available on the given channel, however this may not be practical in all situations, although even when using maximum TX power the client device that I was testing with, an Apple iPhone 13 was still able to achieve data rates of >100Mbps bidirectional at a distance of 100m.
| Radio Profile Slot 1 | Radio Profile Slot 2 | |
| Test #1 | Narrow Beam (Boresight) @ 17dBm (CH140) | Narrow Beam (Boresight) @ 21dBm (CH64) |
| Test #2 | Wide Beam @ 15dBm (CH140) | Wide Beam @ 21dBm (CH140) |
| Test #3 | 10 Degrees from Centre @ 17dBm (CH140) | 10 Degrees from Centre @ 21dBm (CH64) |
| Test #4 | 20 Degrees from Centre @ 17dBm (CH140) | 20 Degrees from Centre @ 21dBm (CH64) |
| Test #5 | 10 Degrees from Centre @ 11dBm (CH140) | 10 Degrees from Centre @ 15dBm (CH64) |
| Test #6 | 20 Degrees from Centre @ 11dBm (CH140) | 20 Degrees from Centre @ 15dBm (CH64) |
The Test Area
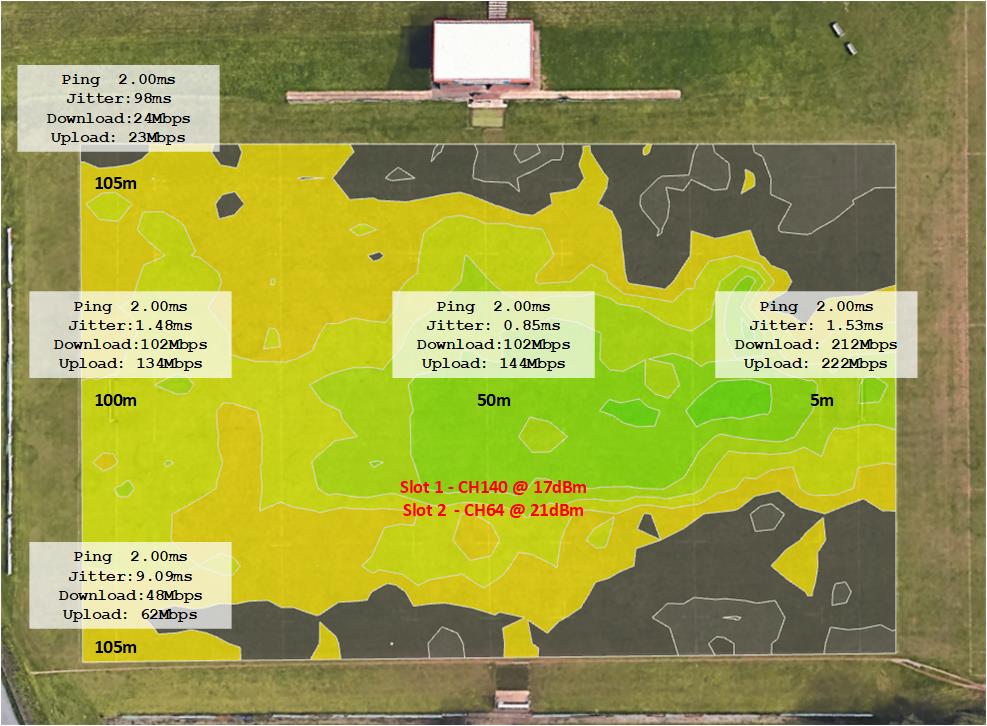
One standard 1st Xi UK rugby pitch. The AP was placed underneath the goal posts at the position shown, centre field aimed directly at the opposing end of the pitch. Weather during the test was mild and dry, with temperatures of approximately 15 degrees Celsius.
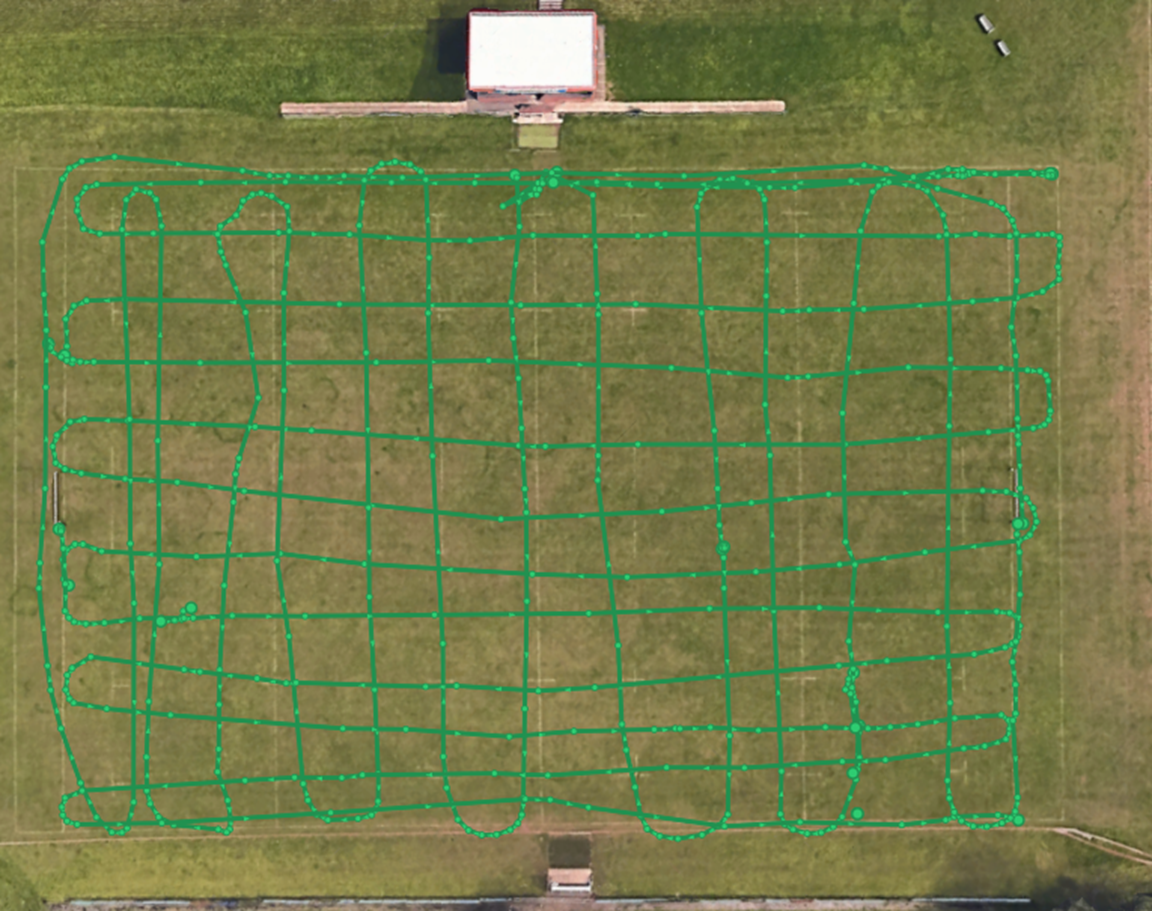
Survey Paths
For each test, I tried as best I could to follow a similar survey path east/west and north/south. Testing was conducted using an Apple iPad Pro and Ekahau Site Survey operating in Auto Pilot, this uses LiDAR and Apple’s ARKit to automatically track the survey path, once it has been calibrated against a scaled floorplan, this worked extremely well outdoors when combined with the capabilities of the iPad Pro and allowed me to just focus on points of reference whilst I was walking.
Even with the accuracy in Ekahau set to 5m, I was still covering @2.5KMs on each survey I conducted.
C9104 AP and Radio Configuration
The C9104 was configured in embedded wireless controller (EWC) mode and running IOS-XE 17.9.3.
Two SSIDs were configured and band locked, one of 2.4GHz named “SURVEY 24) and one on 5GHz named “SURVEY 50)
These SSIDs were associated with the same policy profile and policy tag, which was subsequently attached to the AP.
Prior to testing I setup a number of different radio profiles, this was a new feature introduced in IOS-XE 17.6.3 specifically for configuration on the C9104 but now extended to also include deployments with APs operating in 6GHZ.
The radio profiles are associated with an RF tag, along with the default site tag and policy tag.
Between each test the RF tag was modified to swap out one radio profile for another and then reset, operating mode of each Slot was confirmed via the GUI before conducting the next test.
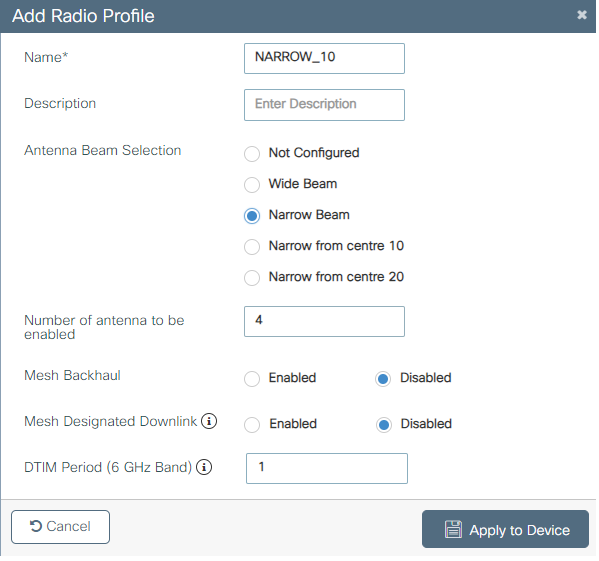
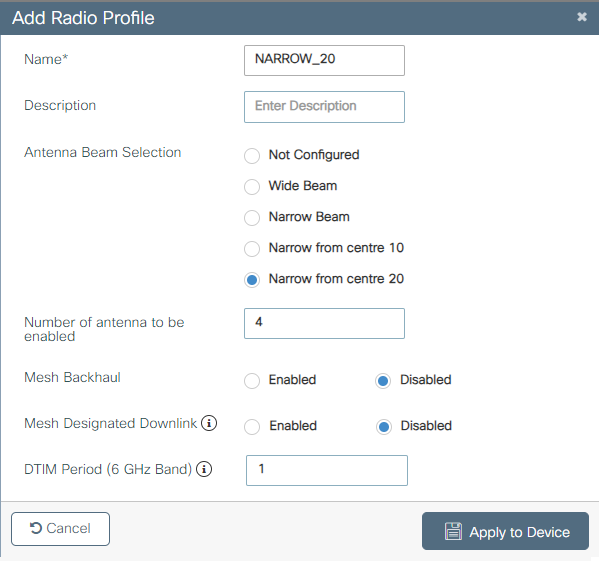
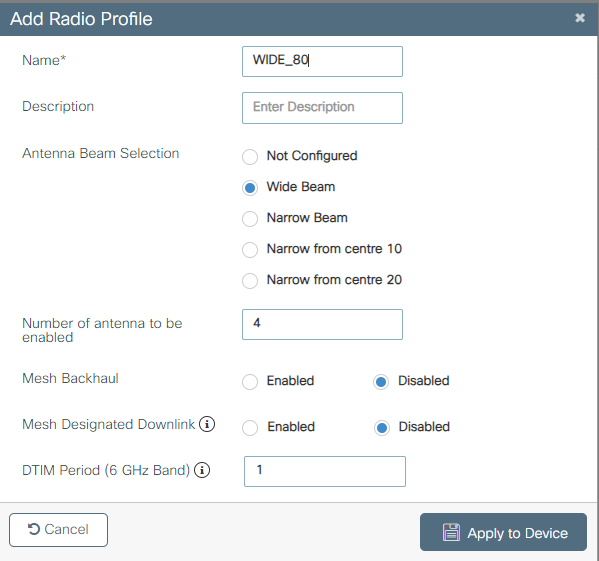
First we create individual radio profiles that will be attached to each of the 2.4 and 5GHz radios as part of an RF Tag.
NB: I did not use RF profiles as TX power and channels were set manually.
NB: Pay special attention to the field “Number of antenna to be enabled” This should always be set to 4, as each radio within the 9130 is 4 x 4 capable.
Radio Profiles – Configuration > Tags & Profiles > RF/Radio
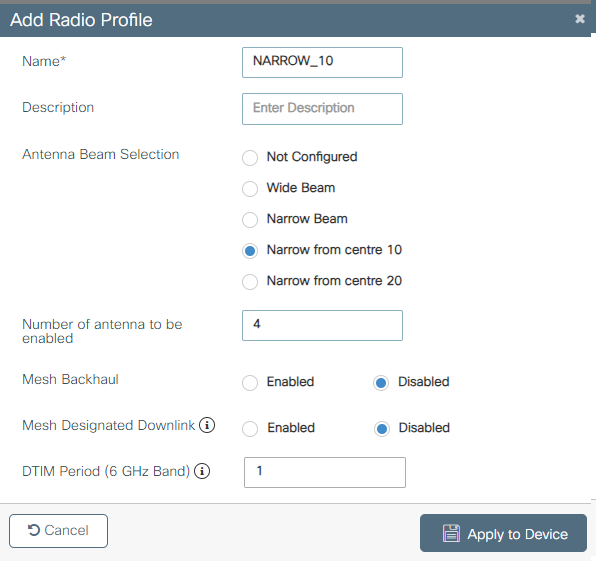
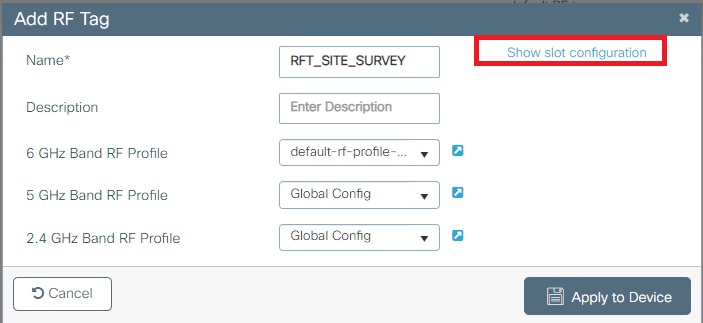
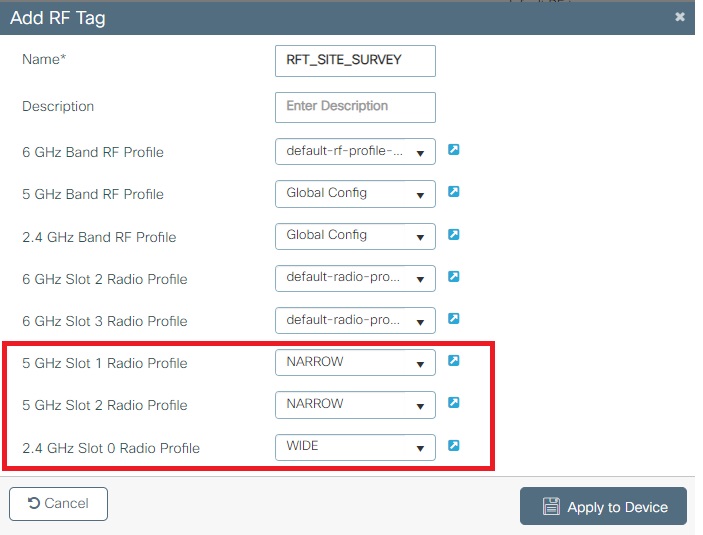
Once Radio Profiles are created, we can combine this as part of an RF Tag which is applied to the AP.
Here we can manipulate the beamwidth of each antenna to meet the paritcular use case, very powerful!
Test Results
Test results are split into two categories, as measured, which visualise how the RF environment was seen from the perspective of the Ekahau Sidekick, and mobile view, which has a 10dB impairment applied to denote how a typical PED may view it.
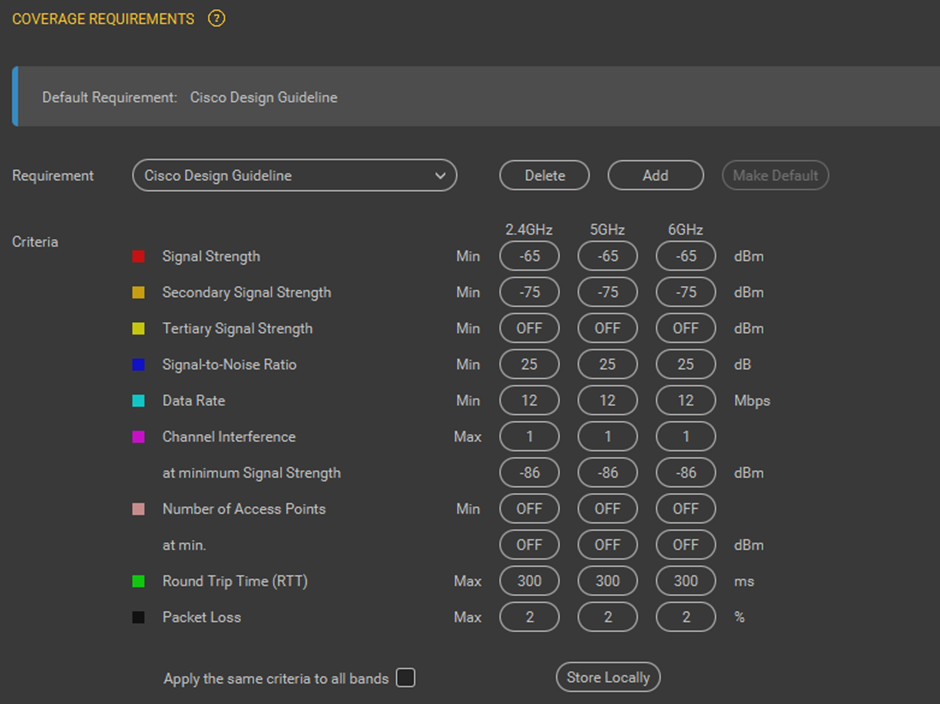
In terms of coverage requirements set within Ekahau to view these visualizations, the default profile for “Cisco Design Guidelines” is defined.
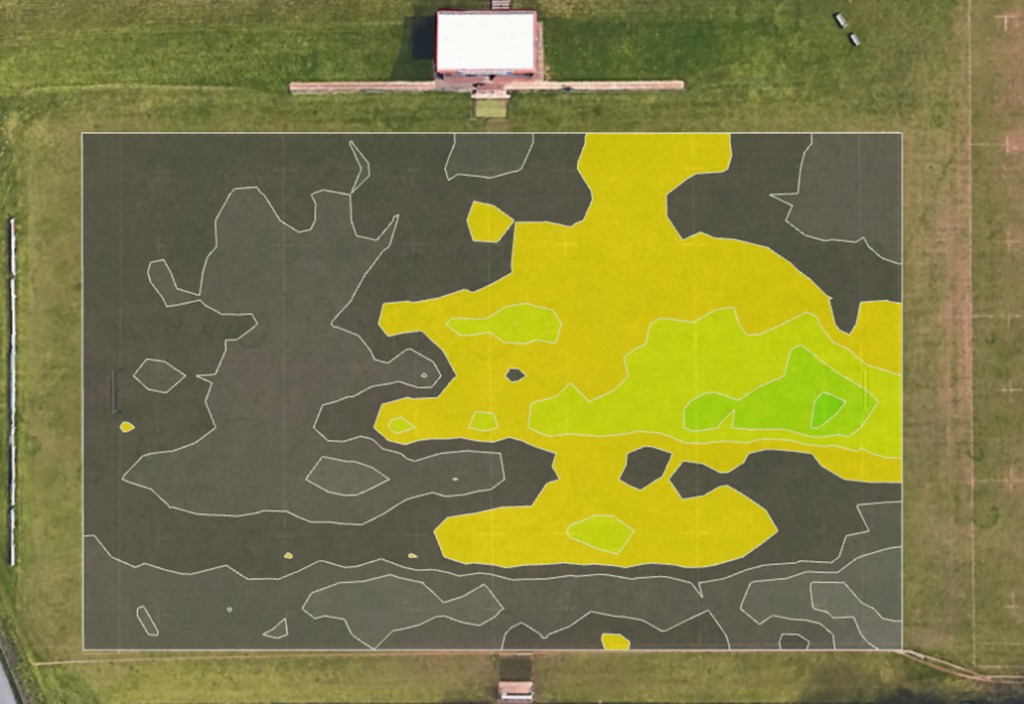
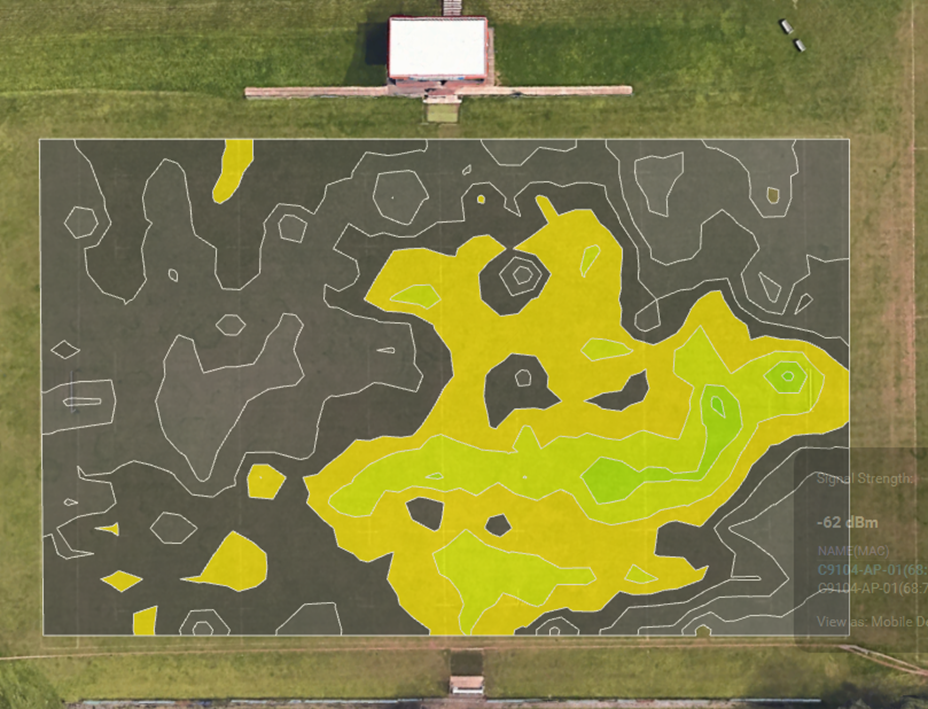
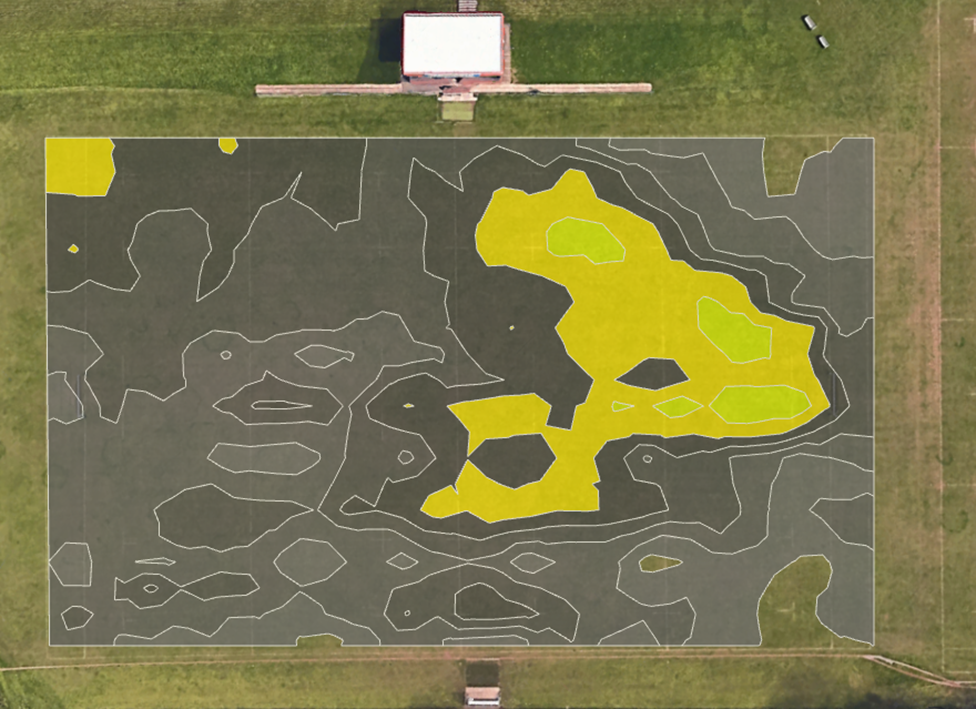
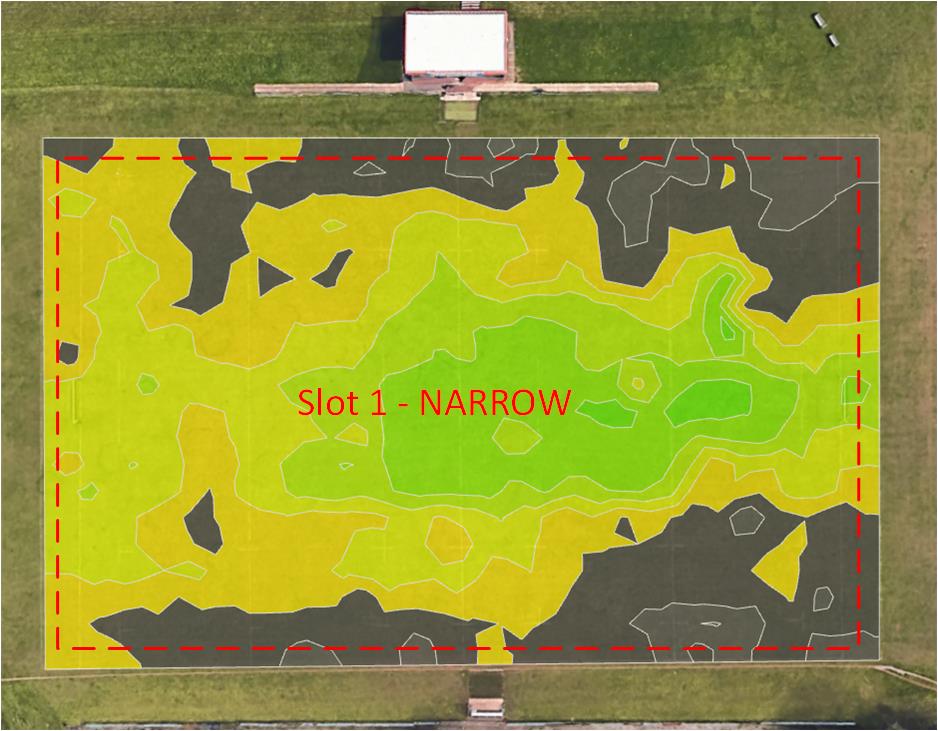
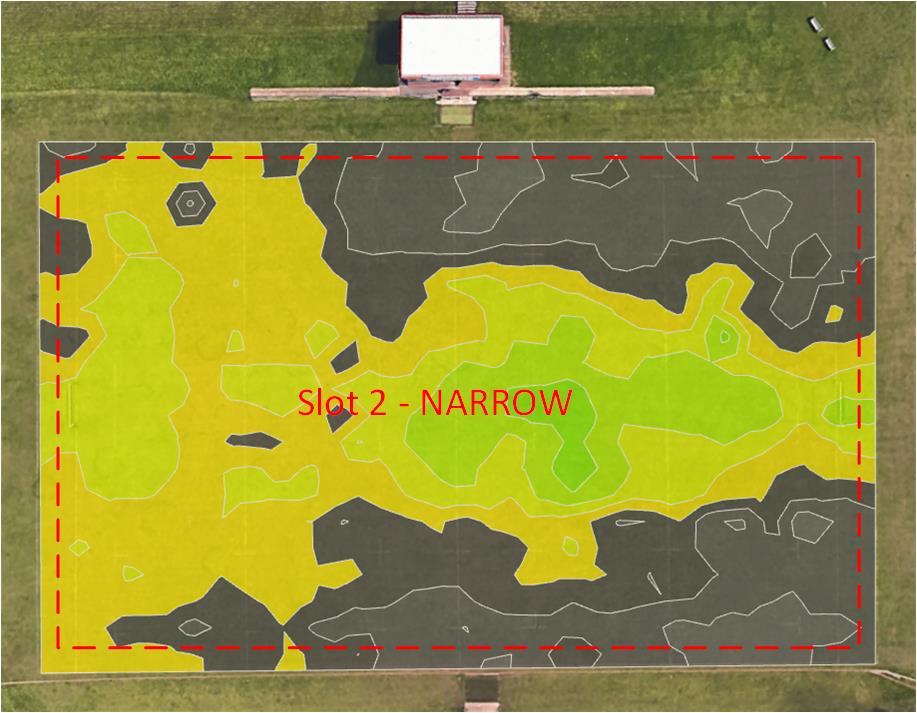
Test #1 – Both Slot 1 & 2 in Narrow Mode (Boresight) – As Measured
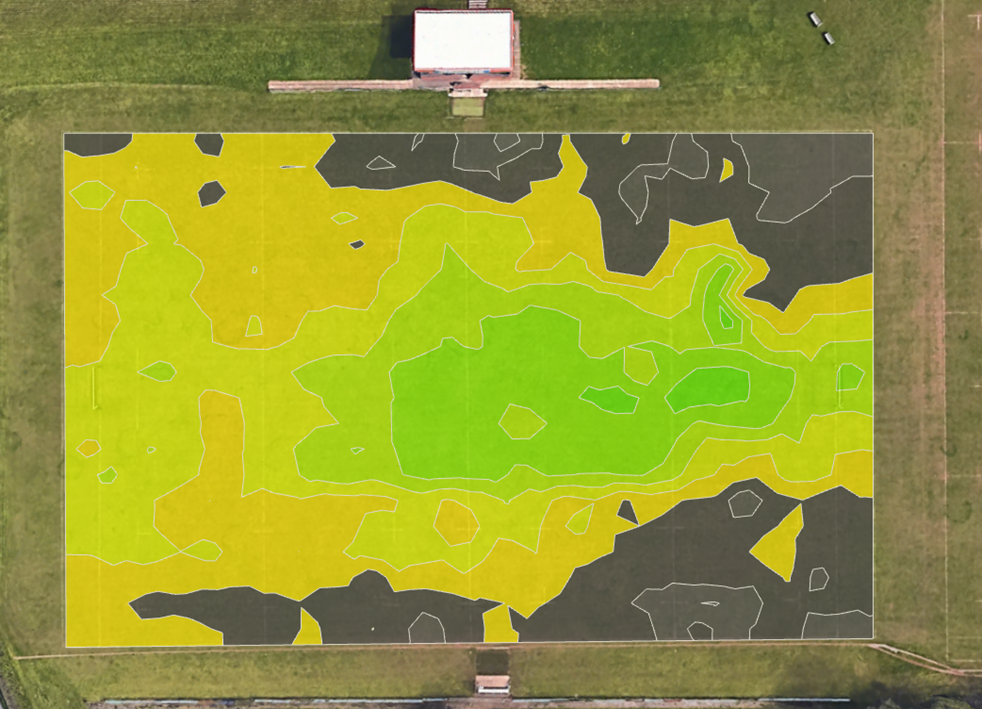
Test #1 – Both Slot 1 & 2 in Narrow Mode (Boresight) – Mobile View (10dBm Offset)
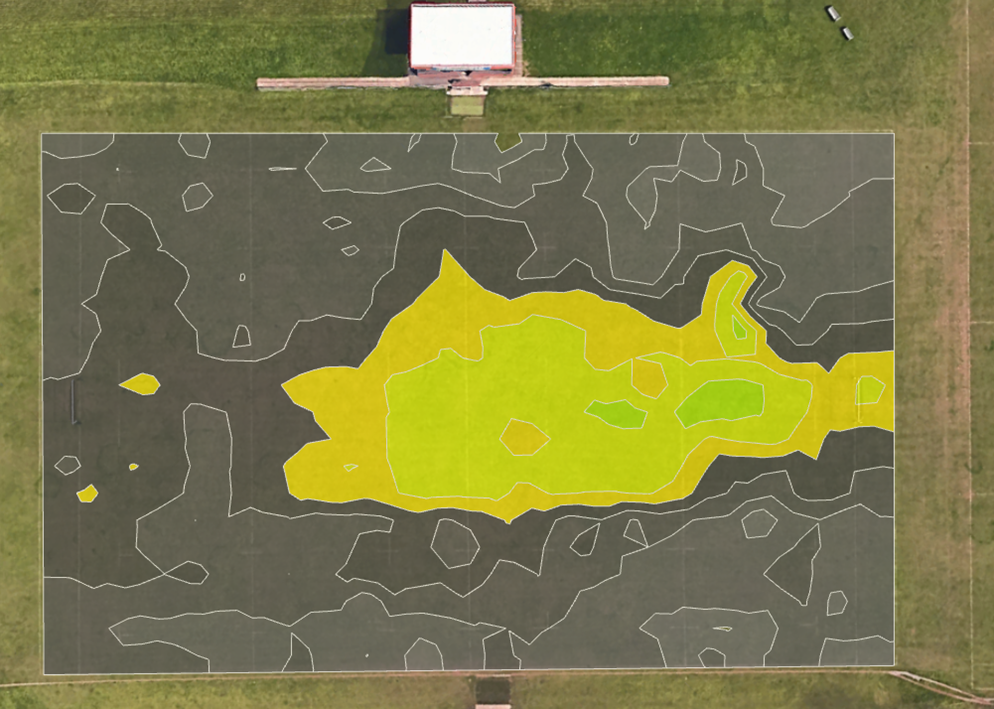
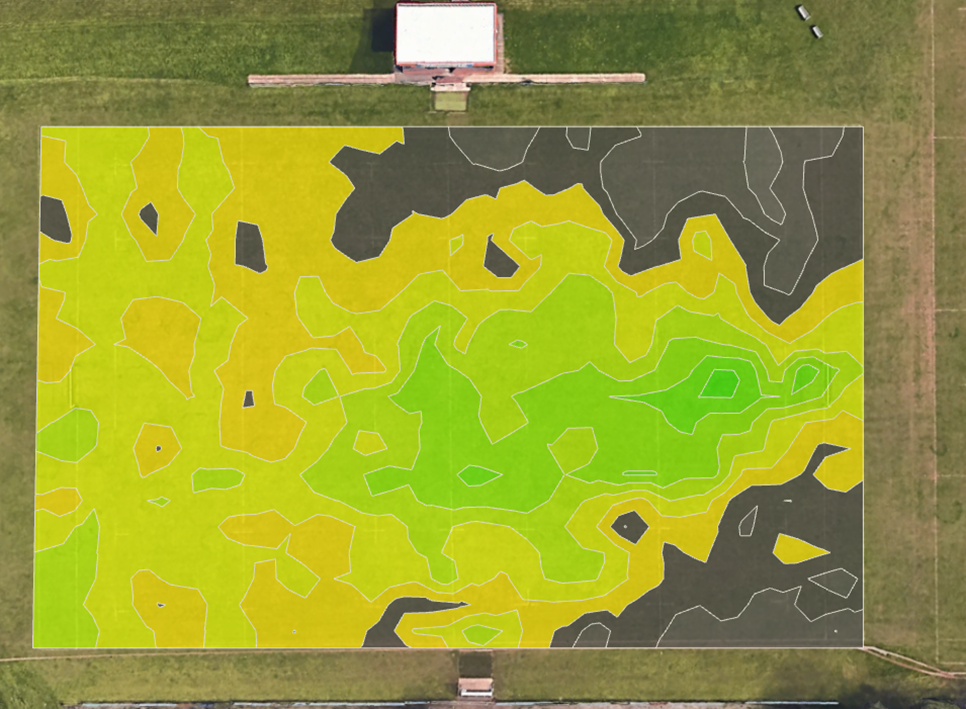
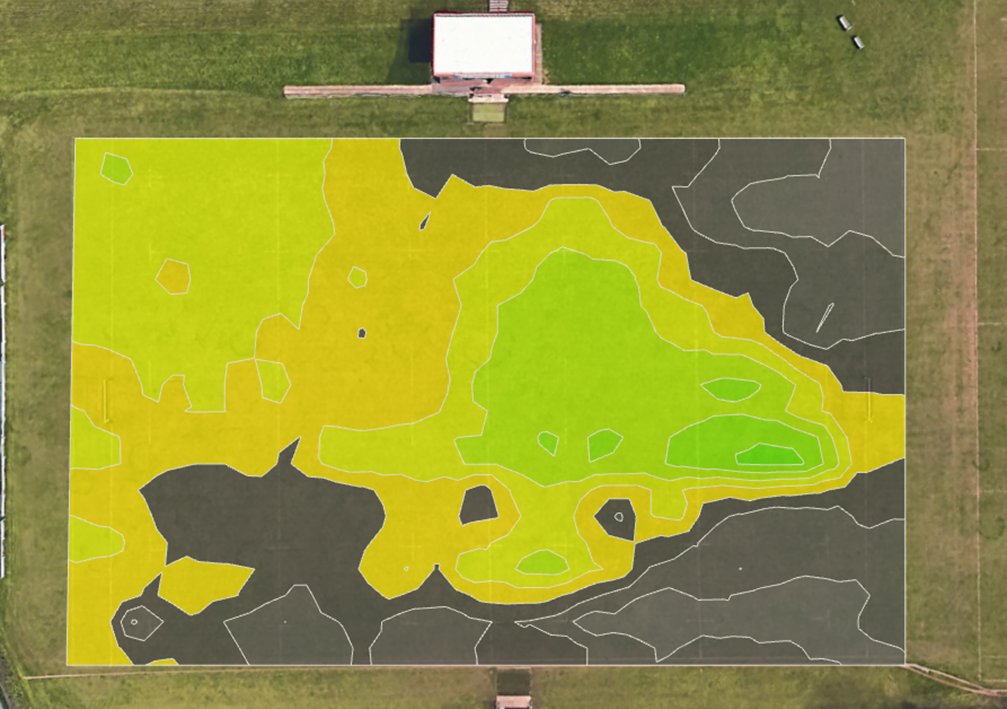
Test #2 – Both Slot 1 & 2 in in Wide Mode – As Measured
Test #2 – Both Slot 1 & 2 in Wide Mode – Mobile View (10dBm Offset)
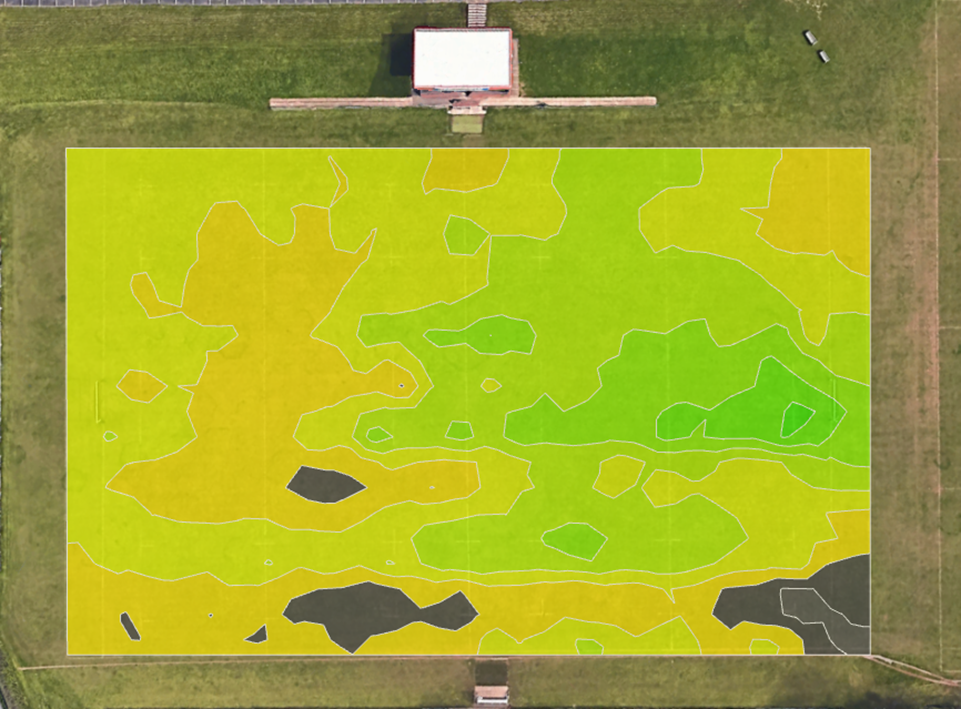
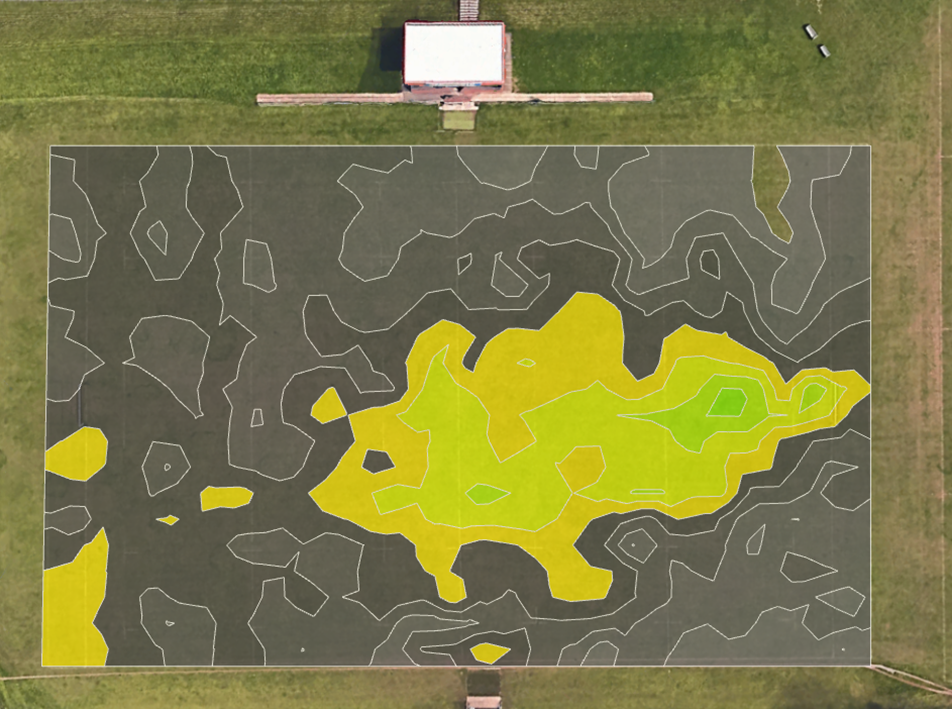
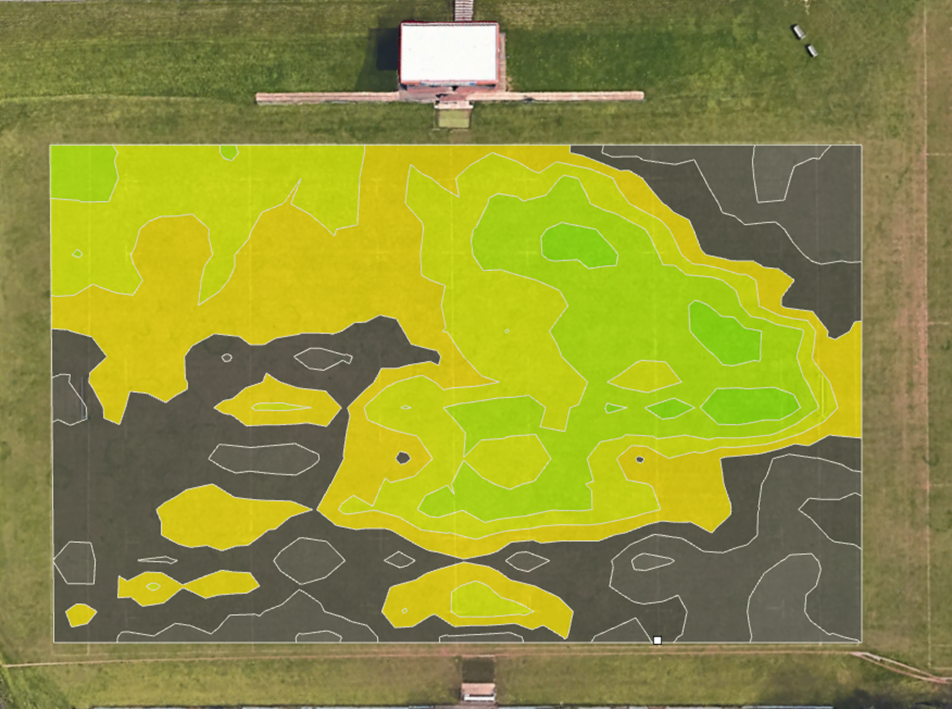
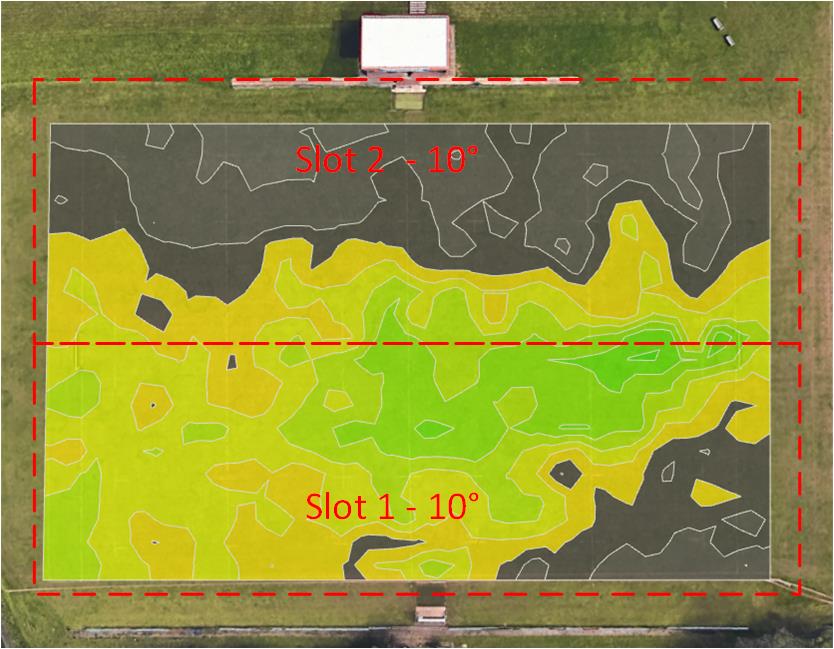
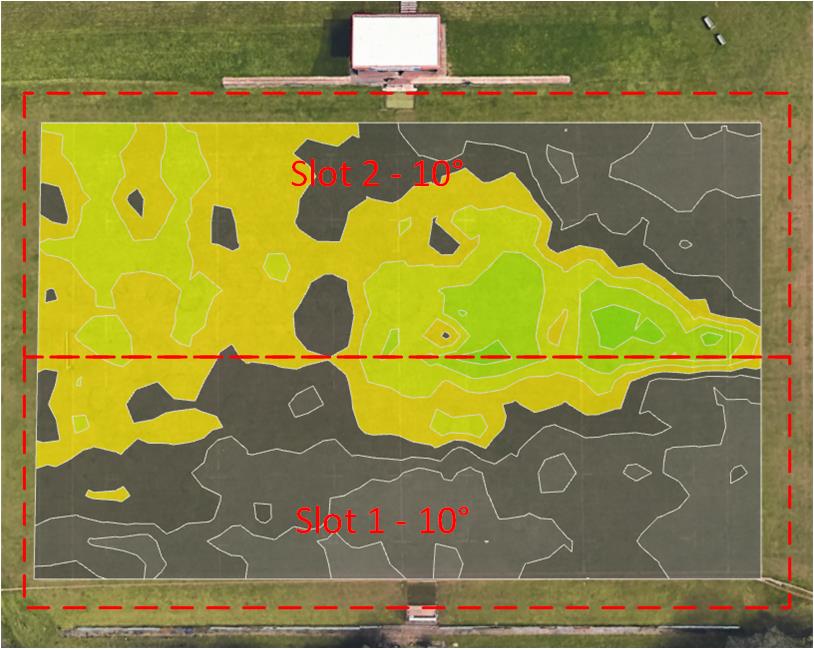
Test #3 – Both Slot 1 & 2 with beams 10 Degrees Off Centre – As Measured
Test #3 – Both Slot 1 & 2 with beams 10 Degrees Off Centre – Mobile View (10dBm Offset)
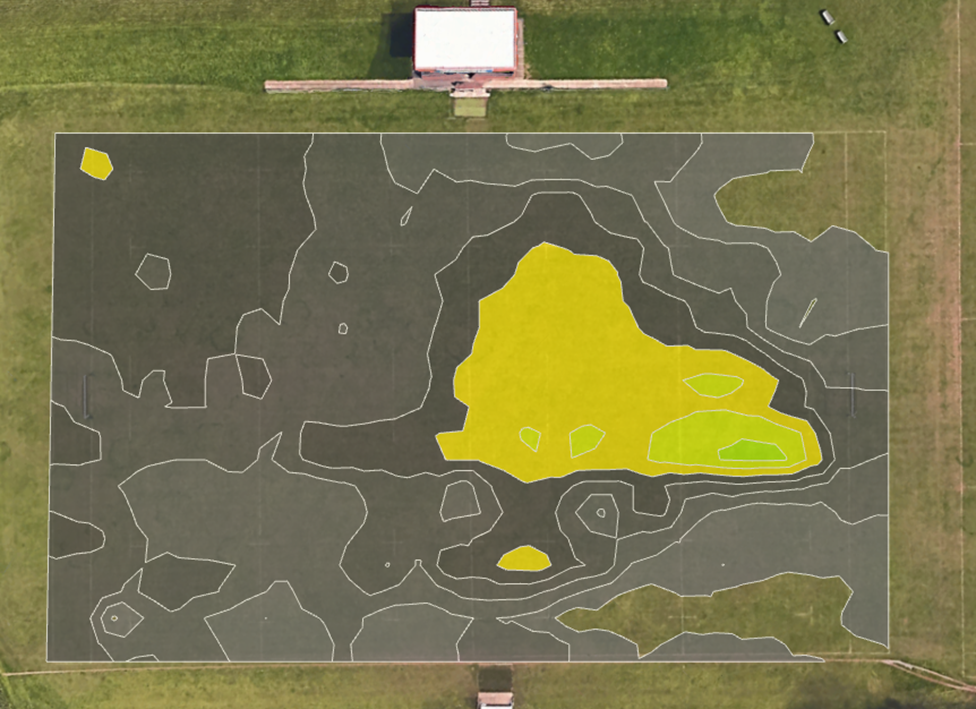
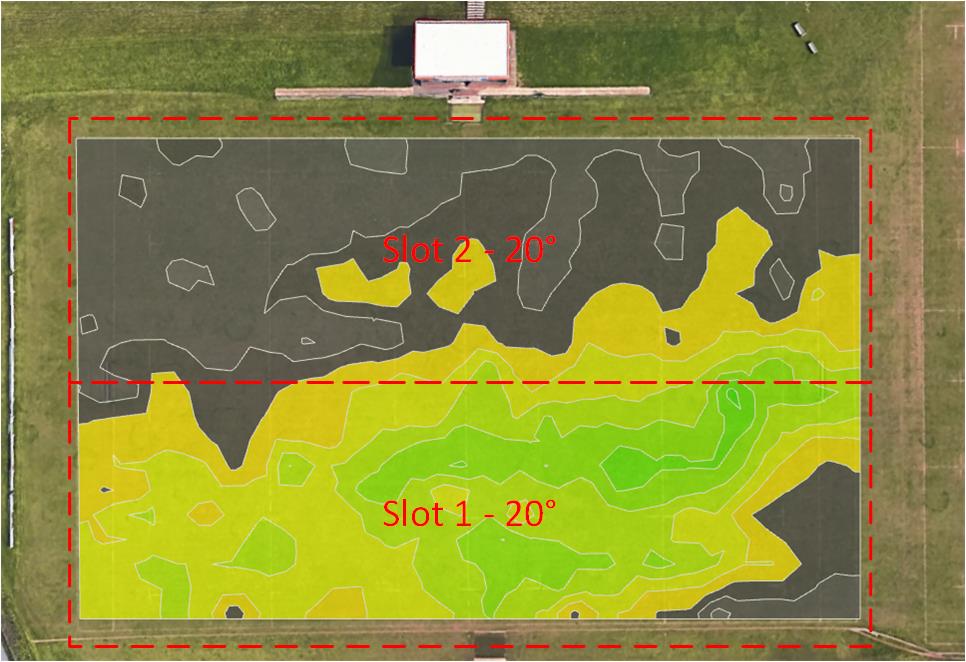
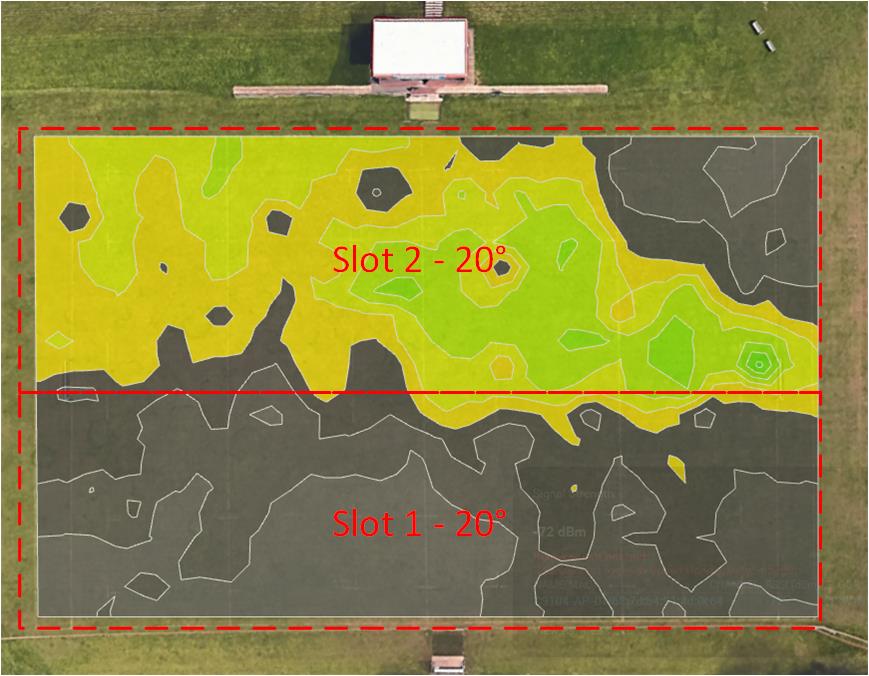
Test #4 – Both Slot 1 & 2 with beams 20 Degrees Off Centre – As Measured
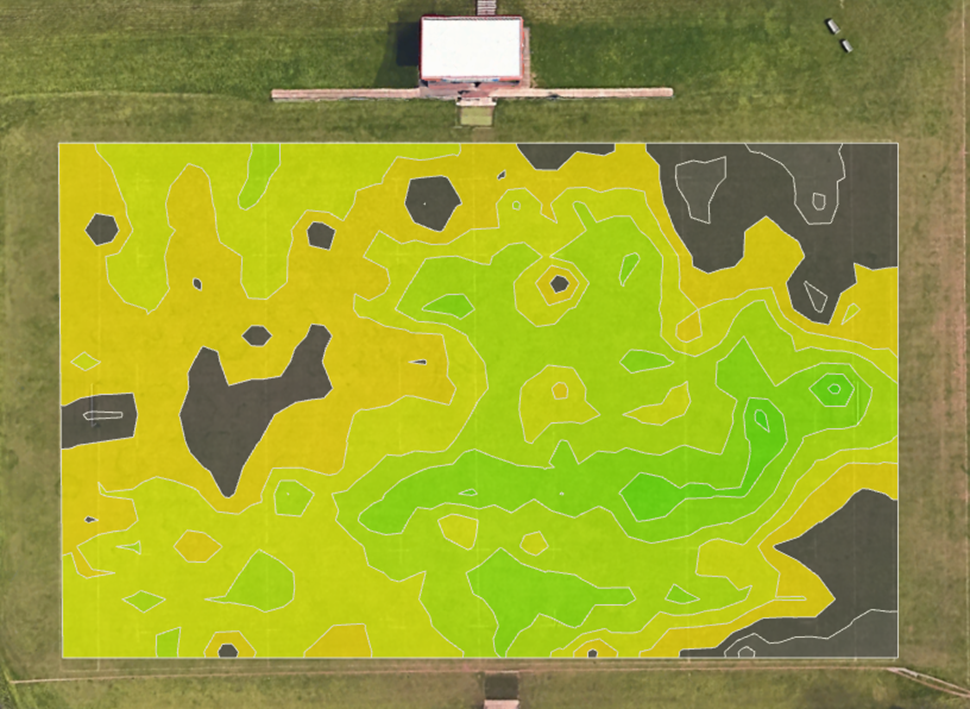
Test #4 – Both Slot 1 & 2 with beams 20 Degrees Off Centre – Mobile View (10dBm Offset)
Test #5 – Both Slot 1 & 2 with beams 10 Degrees Off Centre – Medium Power – As Measured
Test #5 – Both Slot 1 & 2 with beams 10 Degrees Off Centre – Medium Power Mobile View (10dBm Offset)
Test #6 – Both Slot 1 & 2 with beams 20 Degrees Off Centre – Medium Power
Test #6 – Both Slot 1 & 2 with beams 20 Degrees Off Centre – Medium Power Mobile View (10dBm Offset)
Observations
| Test | Notes |
| 1 | As expected, there is a clear biased in terms of RSSI towards centre field, measured signal strength at 50m was between -46 and -51dBm and at 100m -57 and -59dBm respectively. A clear drop of is present north/south of where the AP is situated due to the 25-degree beamwidth being used. |
| 2 | Signal coverage is incredible pervasive, which would be expected given that the beamwidth in this configuration is quoted as being 80 degrees, there is however still biased in the directionality of Slot 2 which is operating at maximum TX power (21dBm) regardless we are still able to achieve -52 and -56 dBm at 50m centre field and -60 and -63dBm at 100m when measured from the goal posts at the opposite end. |
| 3 | Although not immediately obvious, now that beam steering is being used, we can start to see a separation in terms of coverage, although when observed from the POV of both radios simultaneously it is not clear, this will be more evident in the following section when radios are split to denote specific coverage areas for each independent radio. Values of -46 and -57 dBm were recorded at 50m centre field and -58and -60dBm at 100m when measured from the goal posts at the opposite end. |
| 4 | More pronounced than the previous test, now that beam steering is being used, we can see more clearly a separation in terms of coverage, although when observed from the POV of both radios simultaneously it is not entirely clear, this will be more evident in the following section when radios are split to denote specific coverage areas for each independent radio. Values of -59 and -60 dBm were recorded at 50m centre field and -71and -74dBm at 100m when measured from the goal posts at the opposite end, which would be expected now that the beams are split 20 degrees from centre. |
| 5 | An adjustment in maximum TX power had a noticeable impact, especially on Slot 1 which was limited to 11dBm, even when an offset was applied to simulate mobile coverage the effective range of the AP was sill between 40-45m at a RSSI on -65dBm. Values of -65 and -71 dBm were recorded at 50m centre field and -72 and -80dBm at 100m when measured from the goal posts at the opposite end. |
| 6 | Similar results were seen as per the previous test, but with a slightly more pronounced coverage gap toward centre field. Values of -71 and -84 dBm were recorded at 50m centre field and -82 and -86dBm at 100m when measured from the goal posts at the opposite end. Both Tests #5 and 6 are likely more indicative of real-world expectations as it is unlikely that the C9104 would be installed at distances greater than 50m from the intended coverage areas, although based on these results, it is achievable in most circumstances, that being said it highly dependent on individual client capabilities. |
Split Radio Coverage
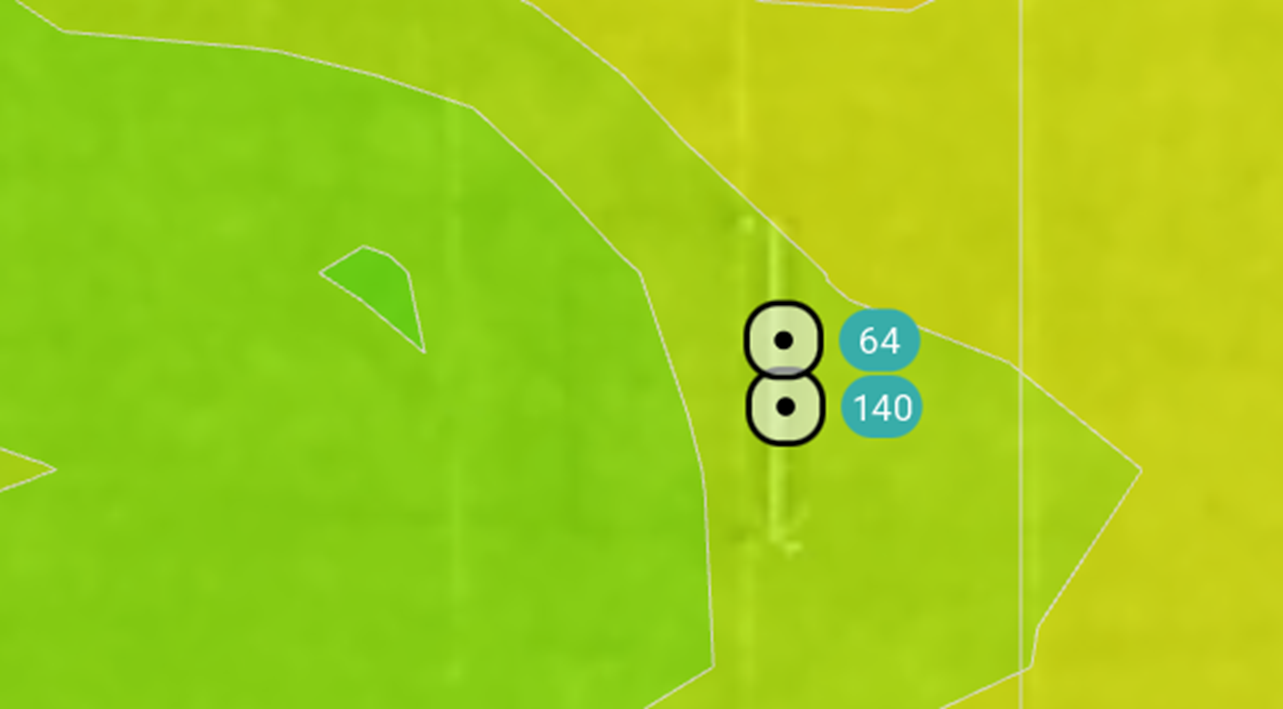
By default, Ekahau has a feature to auto detect multi-MAC access points and as a result, measured APs when positioned on the floor plan during a survey are displayed as a singular AP/device.
In this particular instance, I want to visualize coverage for each radio slot configured in the C9104 AP. To do this we simply select the AP and enable to option to “Separate” the radios, as shown below.
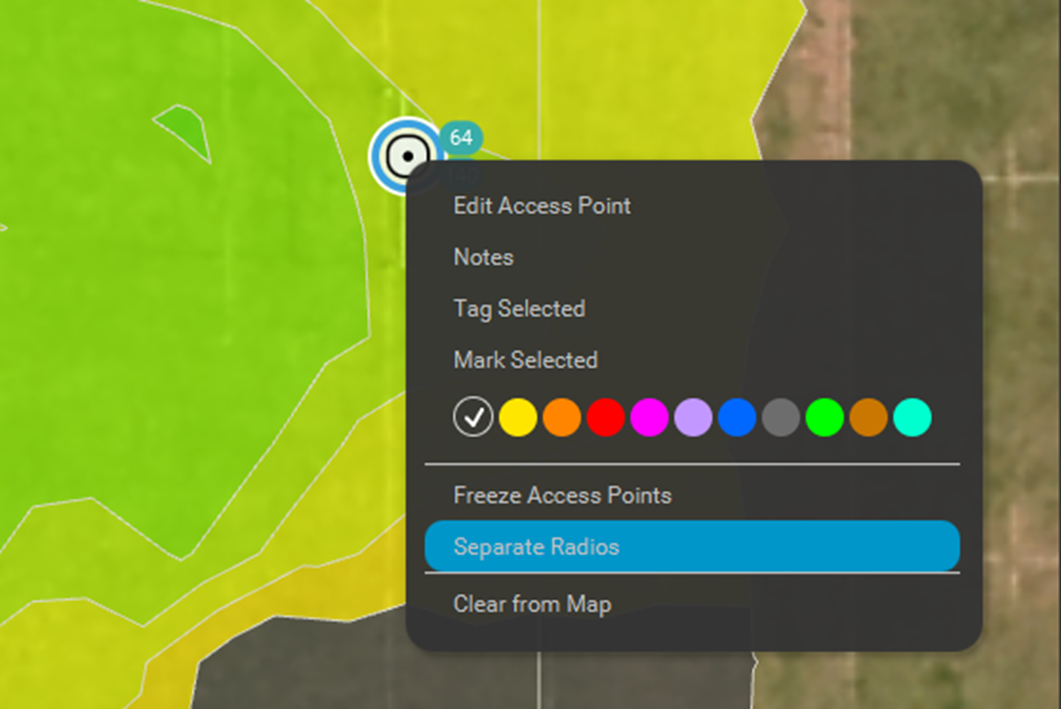
Once enabled, each radio slot can now be visualized independently, which is going to prove very useful in the next section when establishing what depth of coverage is provided in each of the configurable radio profiles.
Observations on Split Radio Coverage
Rach of the radio slots are manually configured with the highest permissible channel within the ETSI (UK) regulatory domain, UNII-3 is still available in the UK of these APs, but support has been enabled now in newer 916x models with the ROW SKU.
This is very deliberate and something that Is generally considered best practice, especially when conducting APoS surveys as the further up the frequency band you go, the higher the impairment for attenuation and thus planning for a worst-case scenario as opposed to testing the AP on a channel towards the beginning of the band, subject to less attenuation.
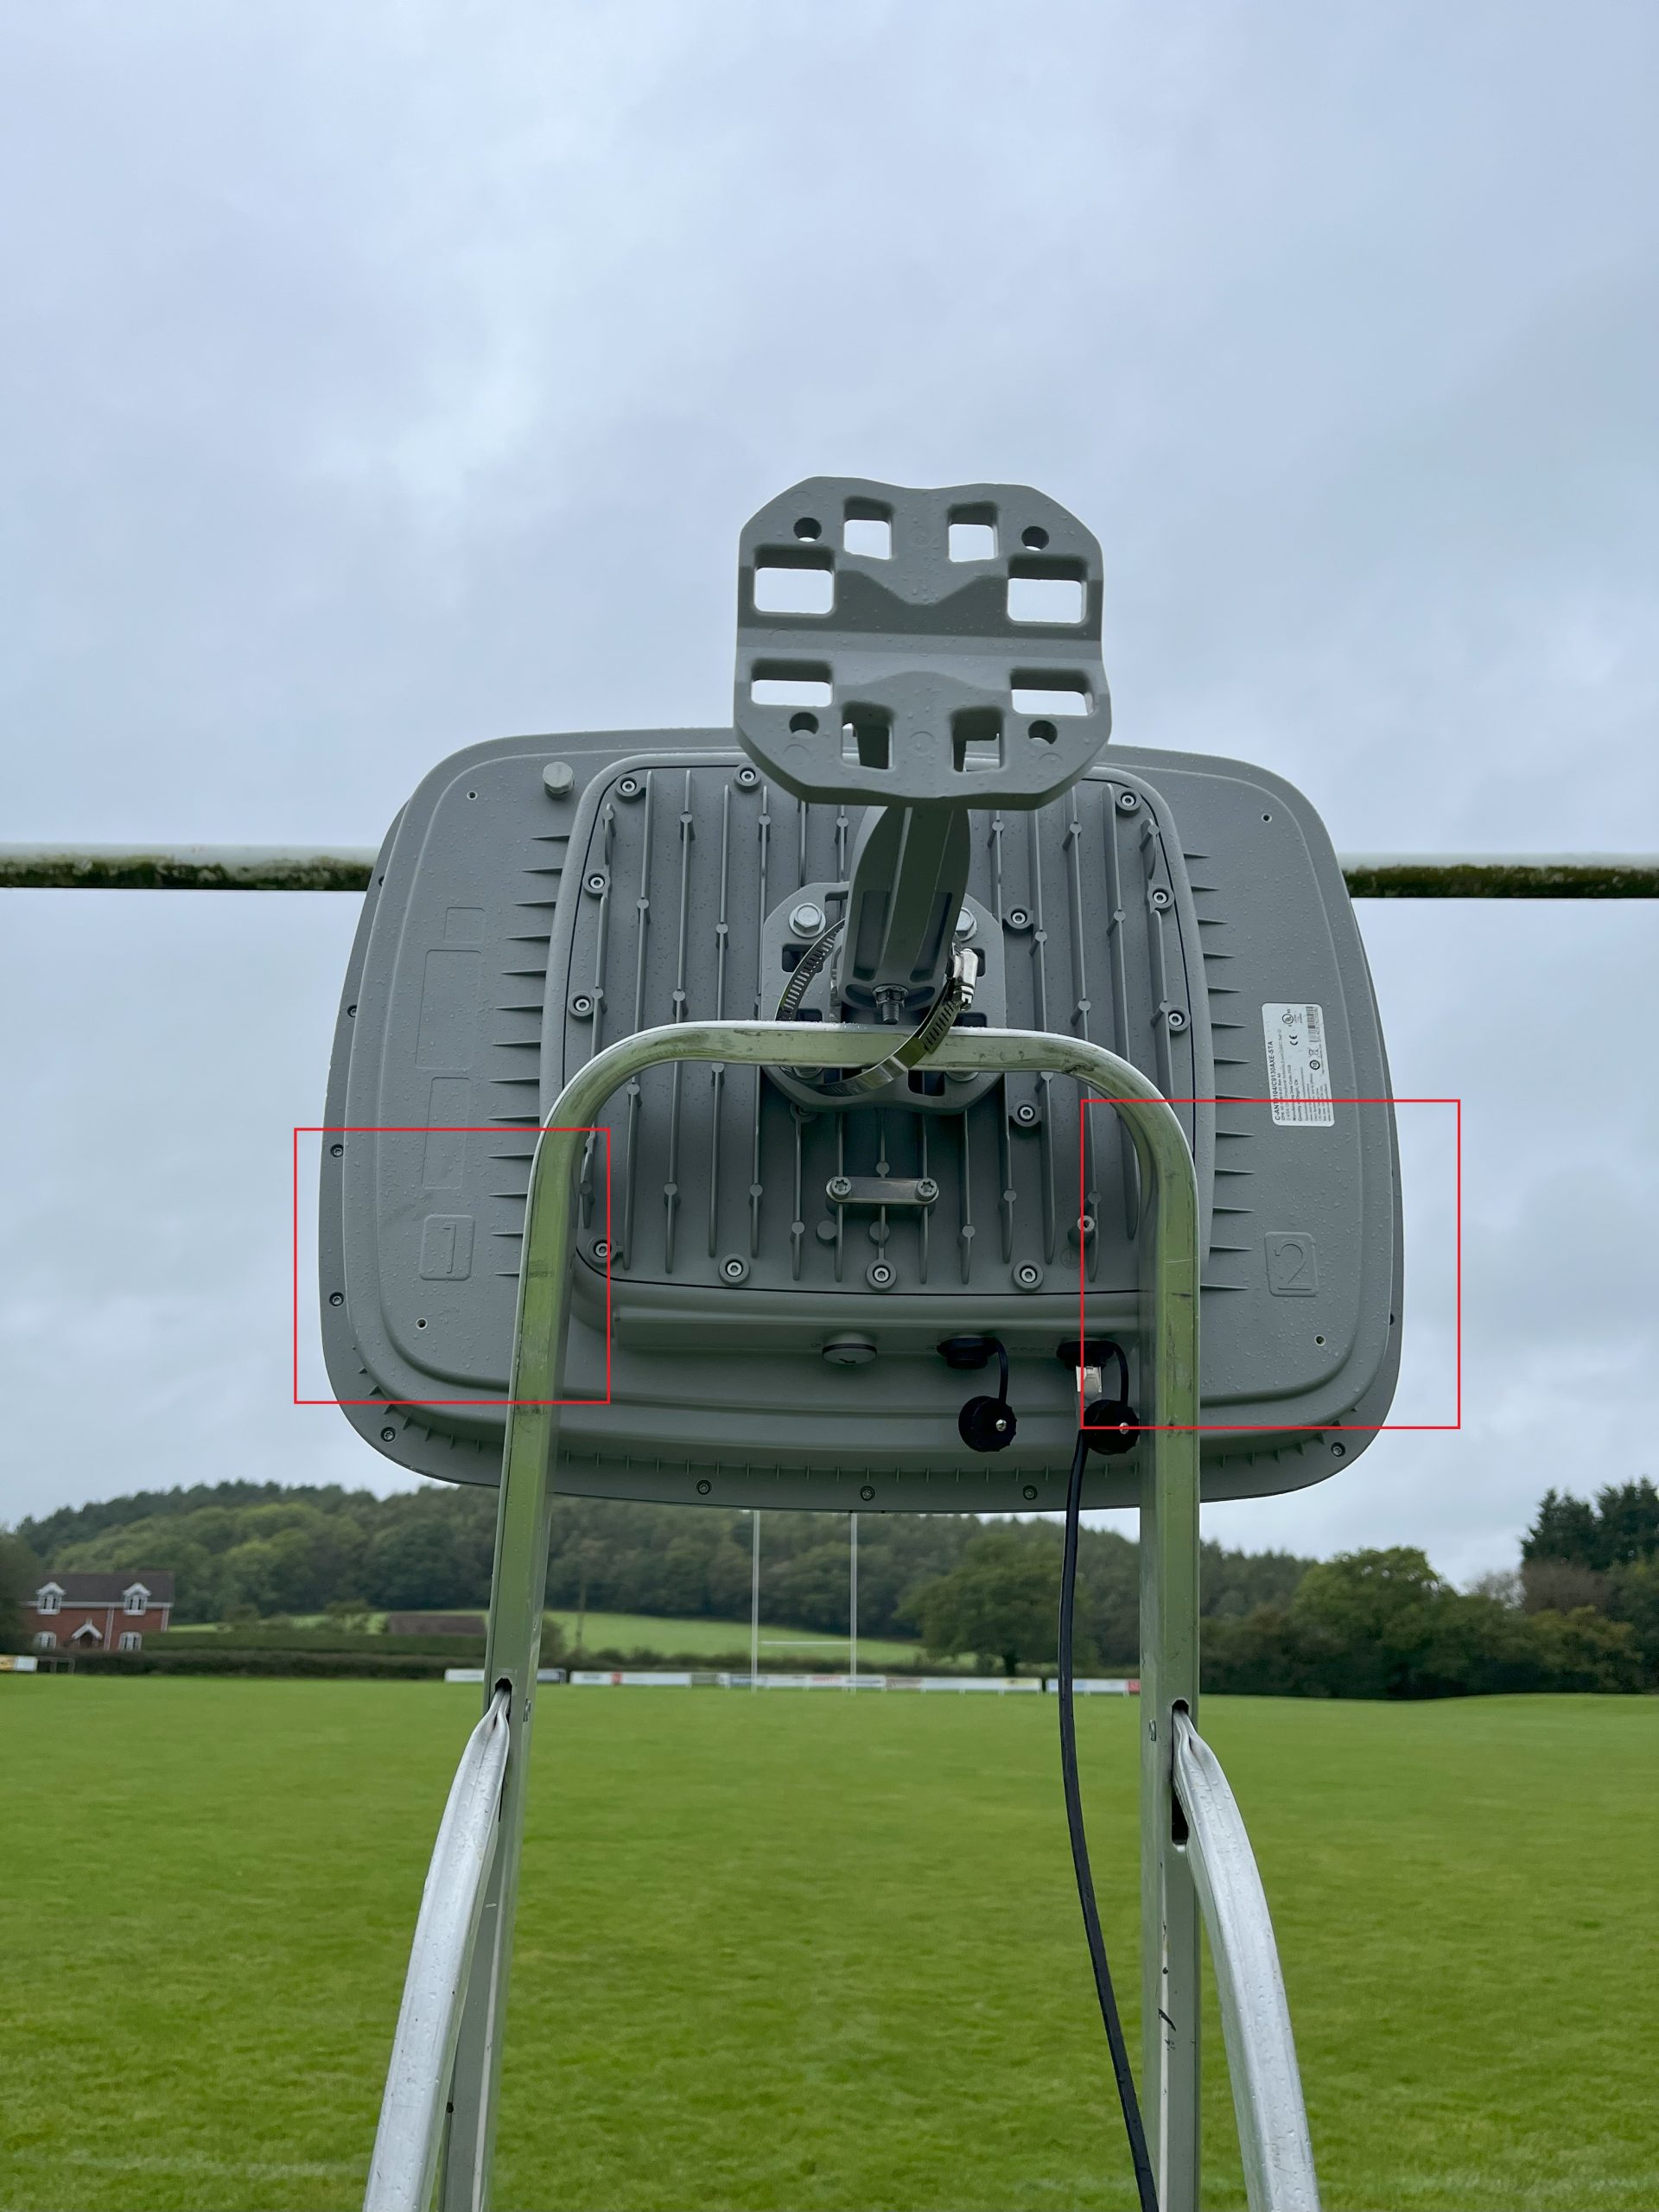
That notwithstanding, on the back of the C9104, the position of each radio slot is clearly marked, which proves very useful to ensure that when installing the AP it is clear how it should be positioned as indicated in a design and take full advantage of the beam steering an switching capabilities.
Split Radio – – Both Slot 1 & 2 with beams 10 Degrees Off Centre – As Measured
Split Radio – Both Slot 1 & 2 with beams 20 Degrees Off Centre – As Measured
Split Radio -Both Slot 1 & 2 in Narrow Mode (Boresight) – As Measured
Range Testing
So, we know that the coverage from the C9104 is pretty incredible, but range is only as good as the associated STAs and their individual capabilities. It is common knowledge that when compared to an AP, personnel electronic devices (PEDs) such as mobile phones and tablets have lesser transmit power, to save battery life and lower receiver sensitivity due to the use of smaller antennas, they also aren’t typically as good as recovering RF signals due to less radio chains, although the majority are at a minimum 2×2 MIMO capable.
That being said, when working in very large indoor, or outdoor spaces, MIMO is not always as effective due to less multipath reflections within the physical environment, which again can have an adverse impact on the SNR when measured as the receiver, techniques such a beamforming rely heavily on this to improve user experience.
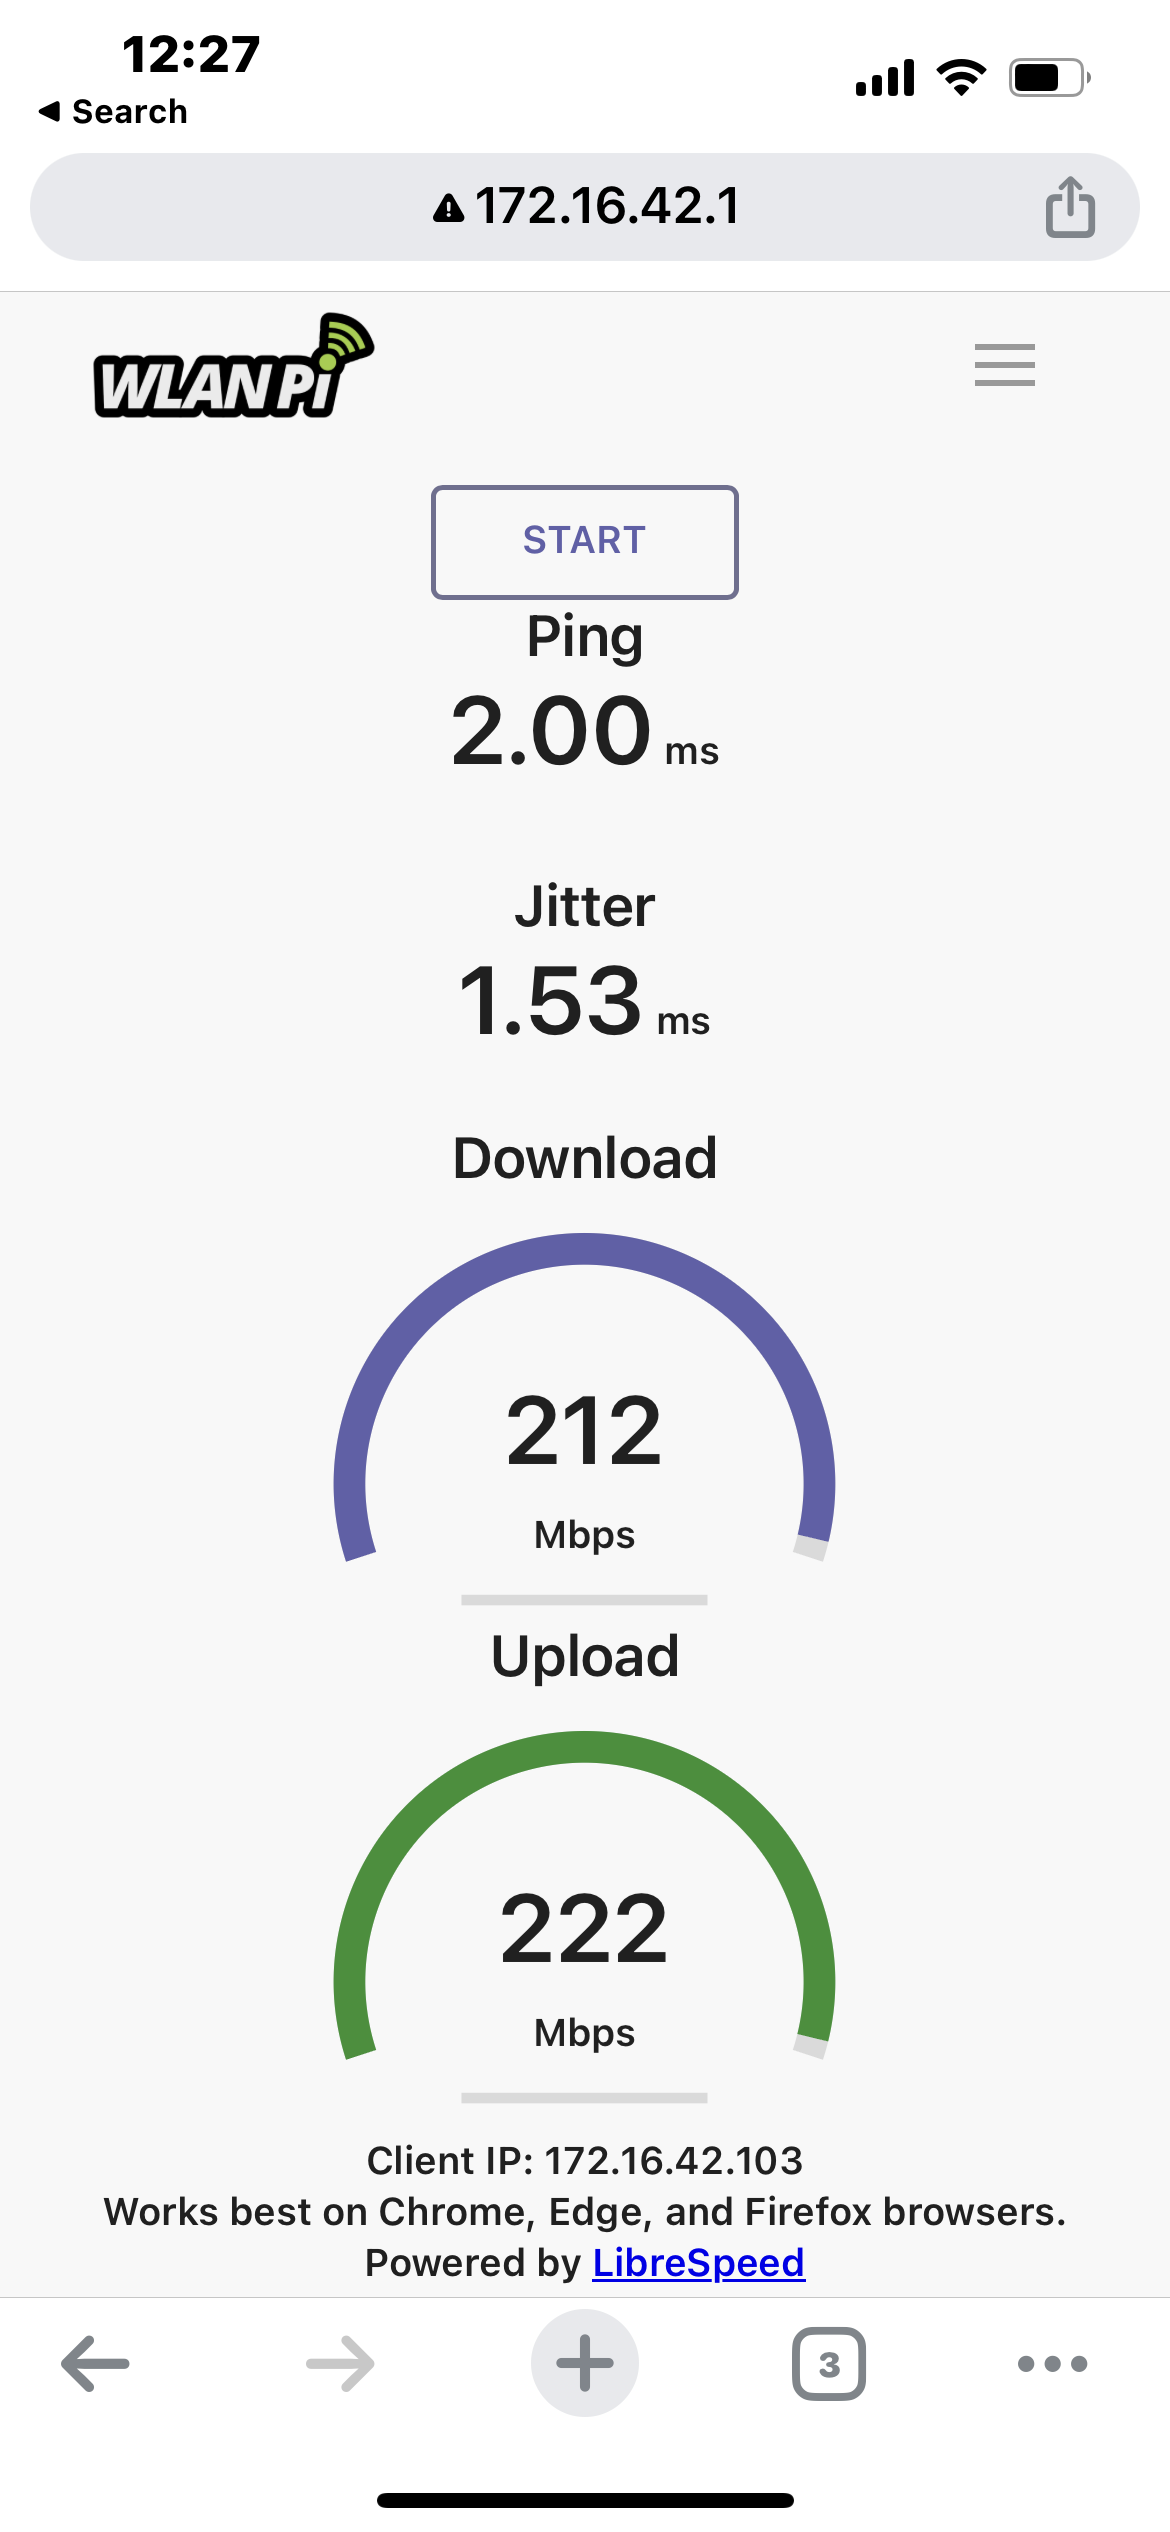
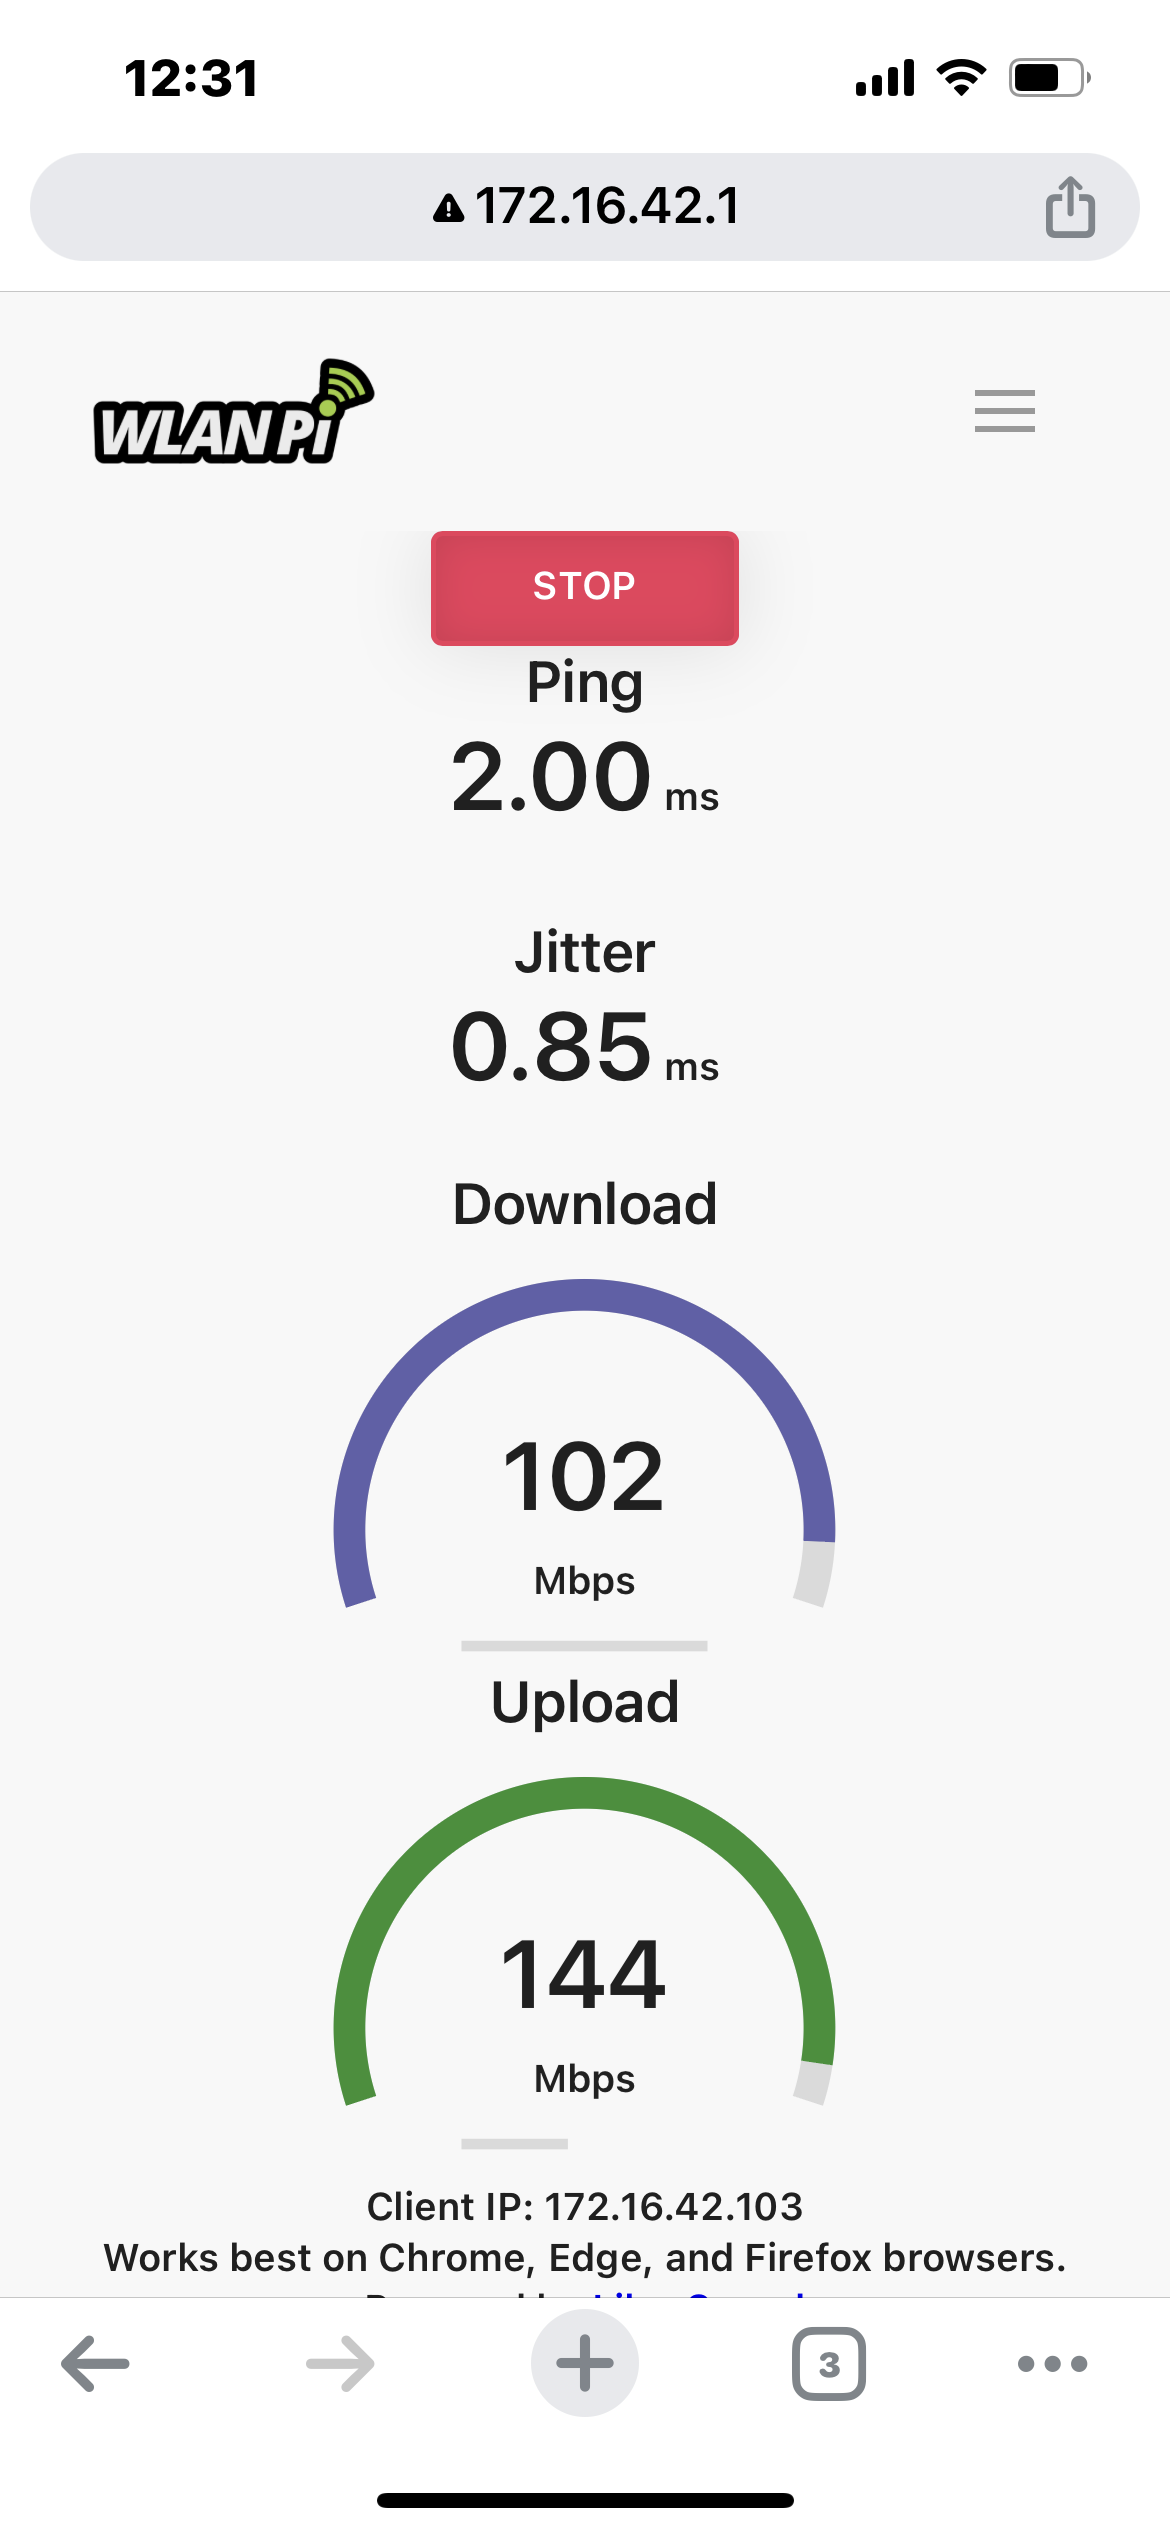
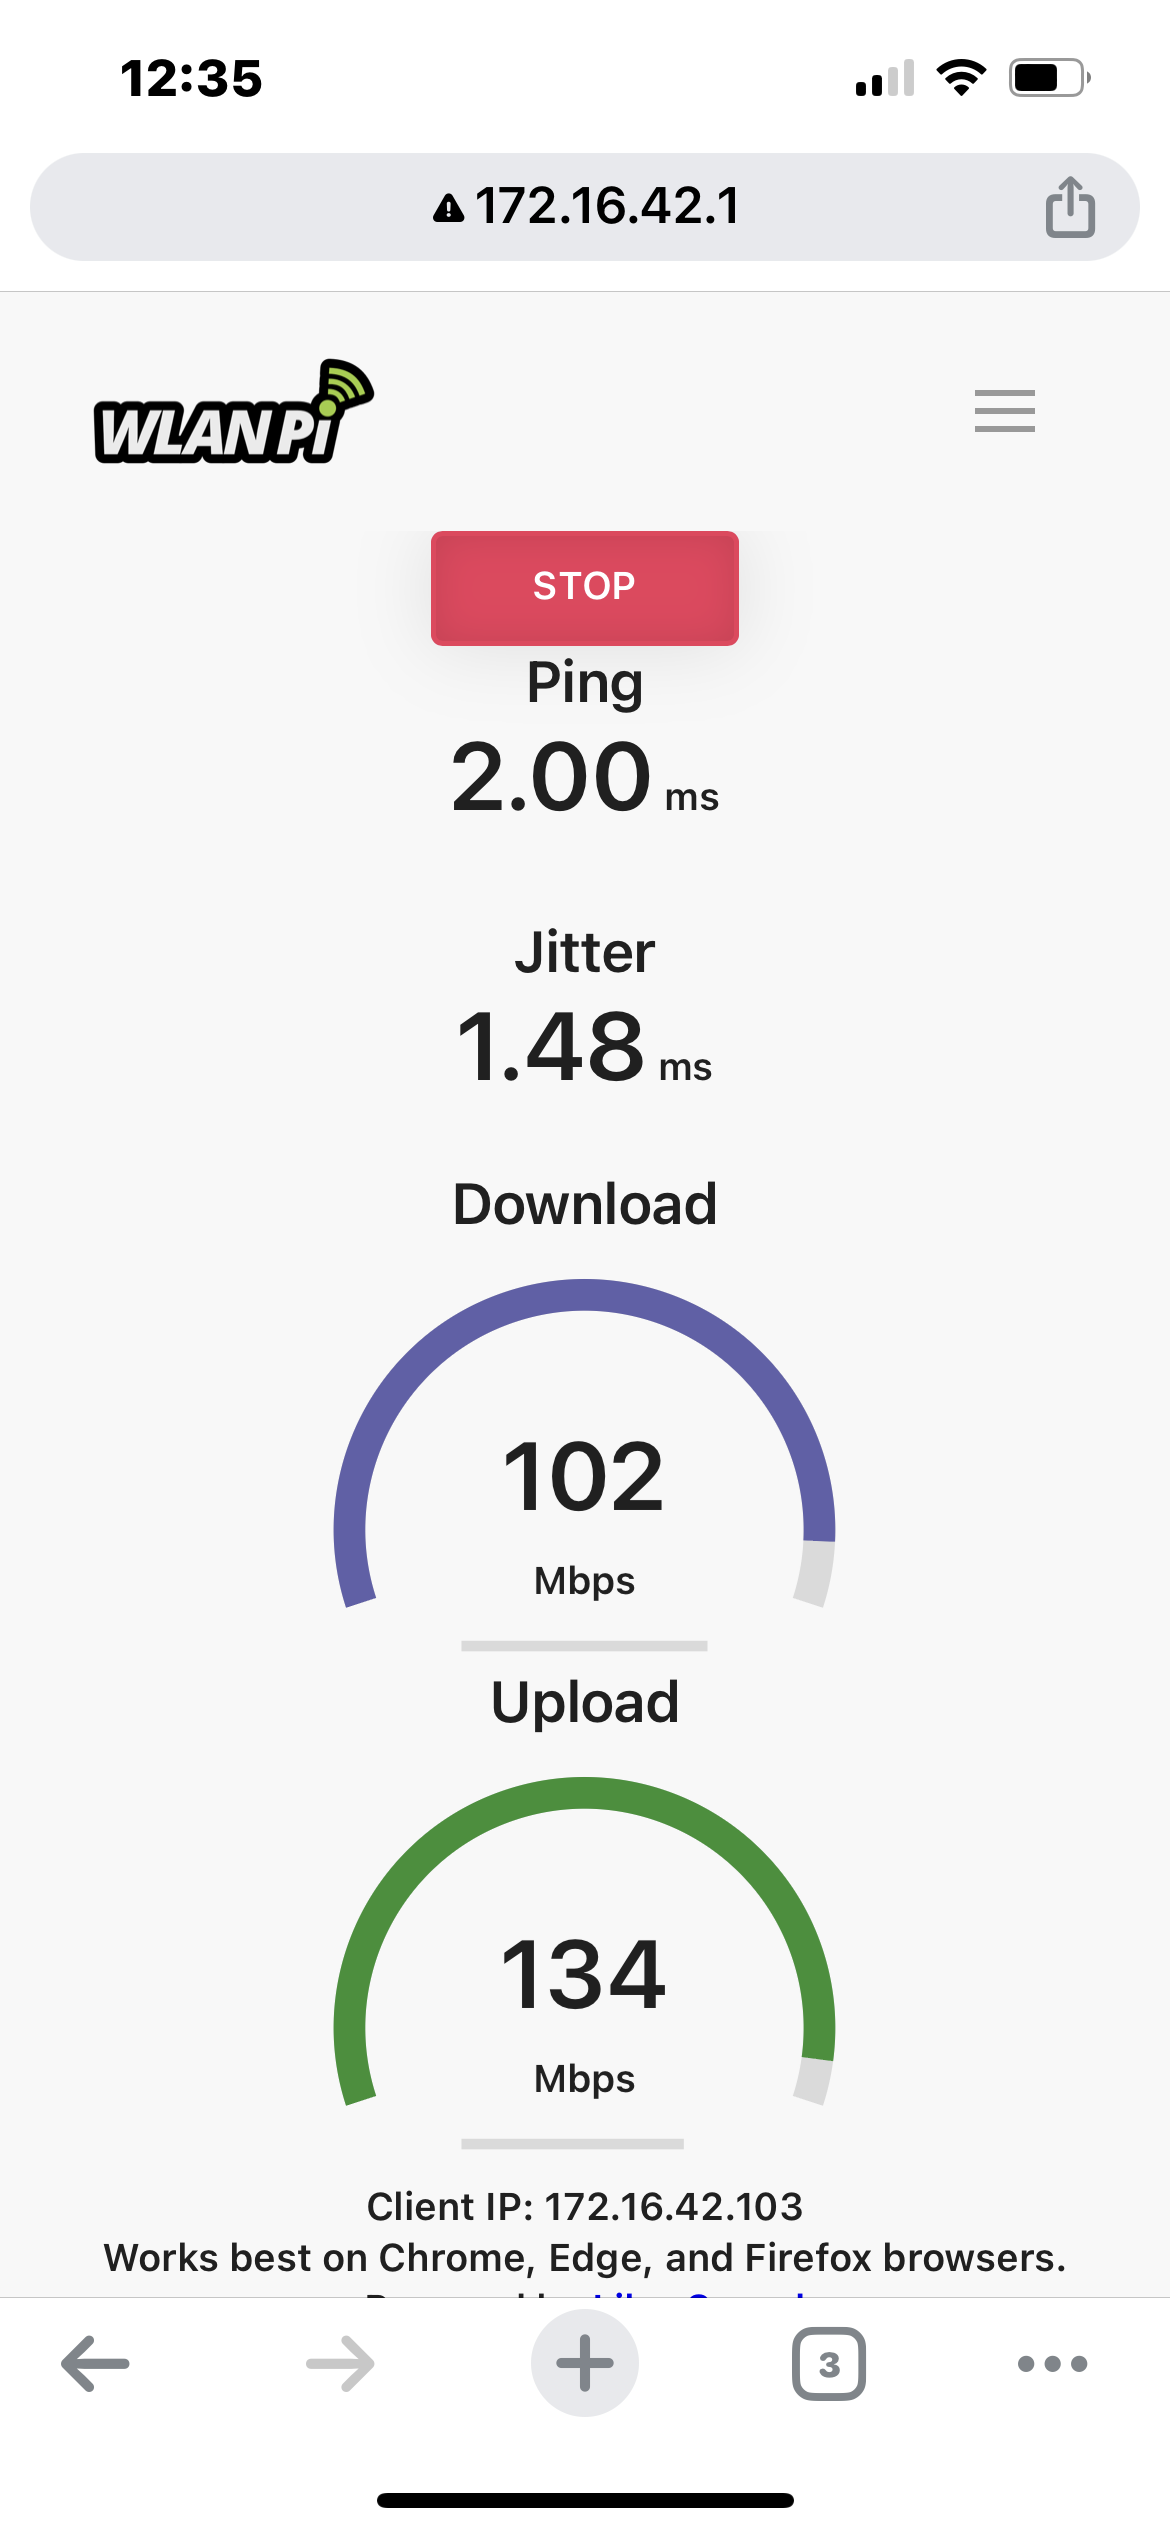
To try and simulate throughout for a single associated STA, I connected a WLANPi the spare ethernet port on the Acceltex battery pack and used the built-in speed test feature to test OTA performance at various locations on the field.
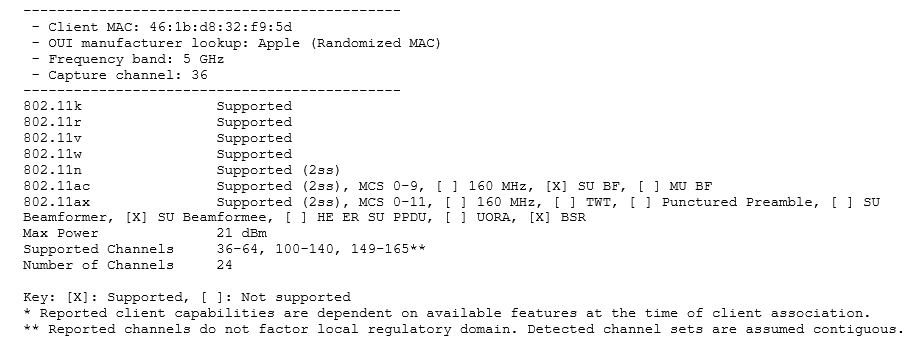
The device used to execute the speed tests was an Apple iPhone 13, which was attached to a 5GHz only SSID and reported as using 802.11x on association to the AP.
Test Setup
- Apple iPhone 13
- WLANPi R4
- PHY: 802.11ax
- BSSID: SURVEY 5.0
- Frequency: 5GHz
- AP Slot 1 – Channel 140 @ 21dbm
- AP Slot 2 – Channel 64 @ 17dBm
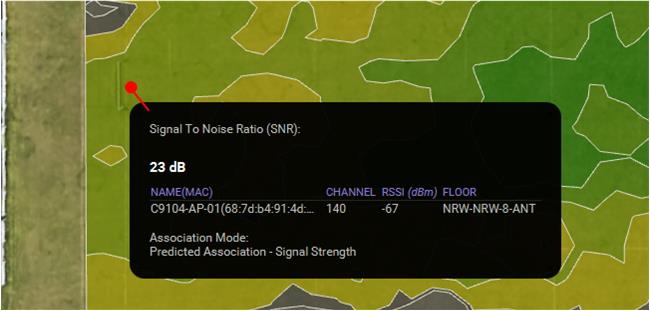
WLANPi Profiler Output – iPhone 13
Range Test Results
Unfortunately, the data I collected to note the measured RSSI of the iPhone at each of these positions from the APs perspective was lost due to my laptop being reimaged and not backed up, which is frustrating as I really would have liked to know what the SNR in order to achieve these throughput values.
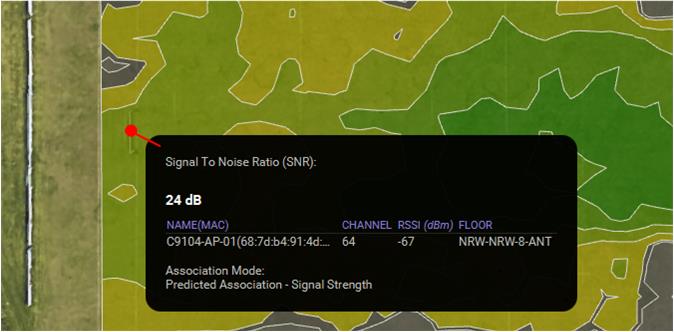
If, however I apply an offset within Ekahau to simulate a mobile device, at 100m the RSSI and SNR recorded on each radio is almost identical, which given the delta in terms of TX power on each slot, is pretty impressive!
NB: These values were recorded standing inbetween the goal posts at the opposite end of the field – 100M away.
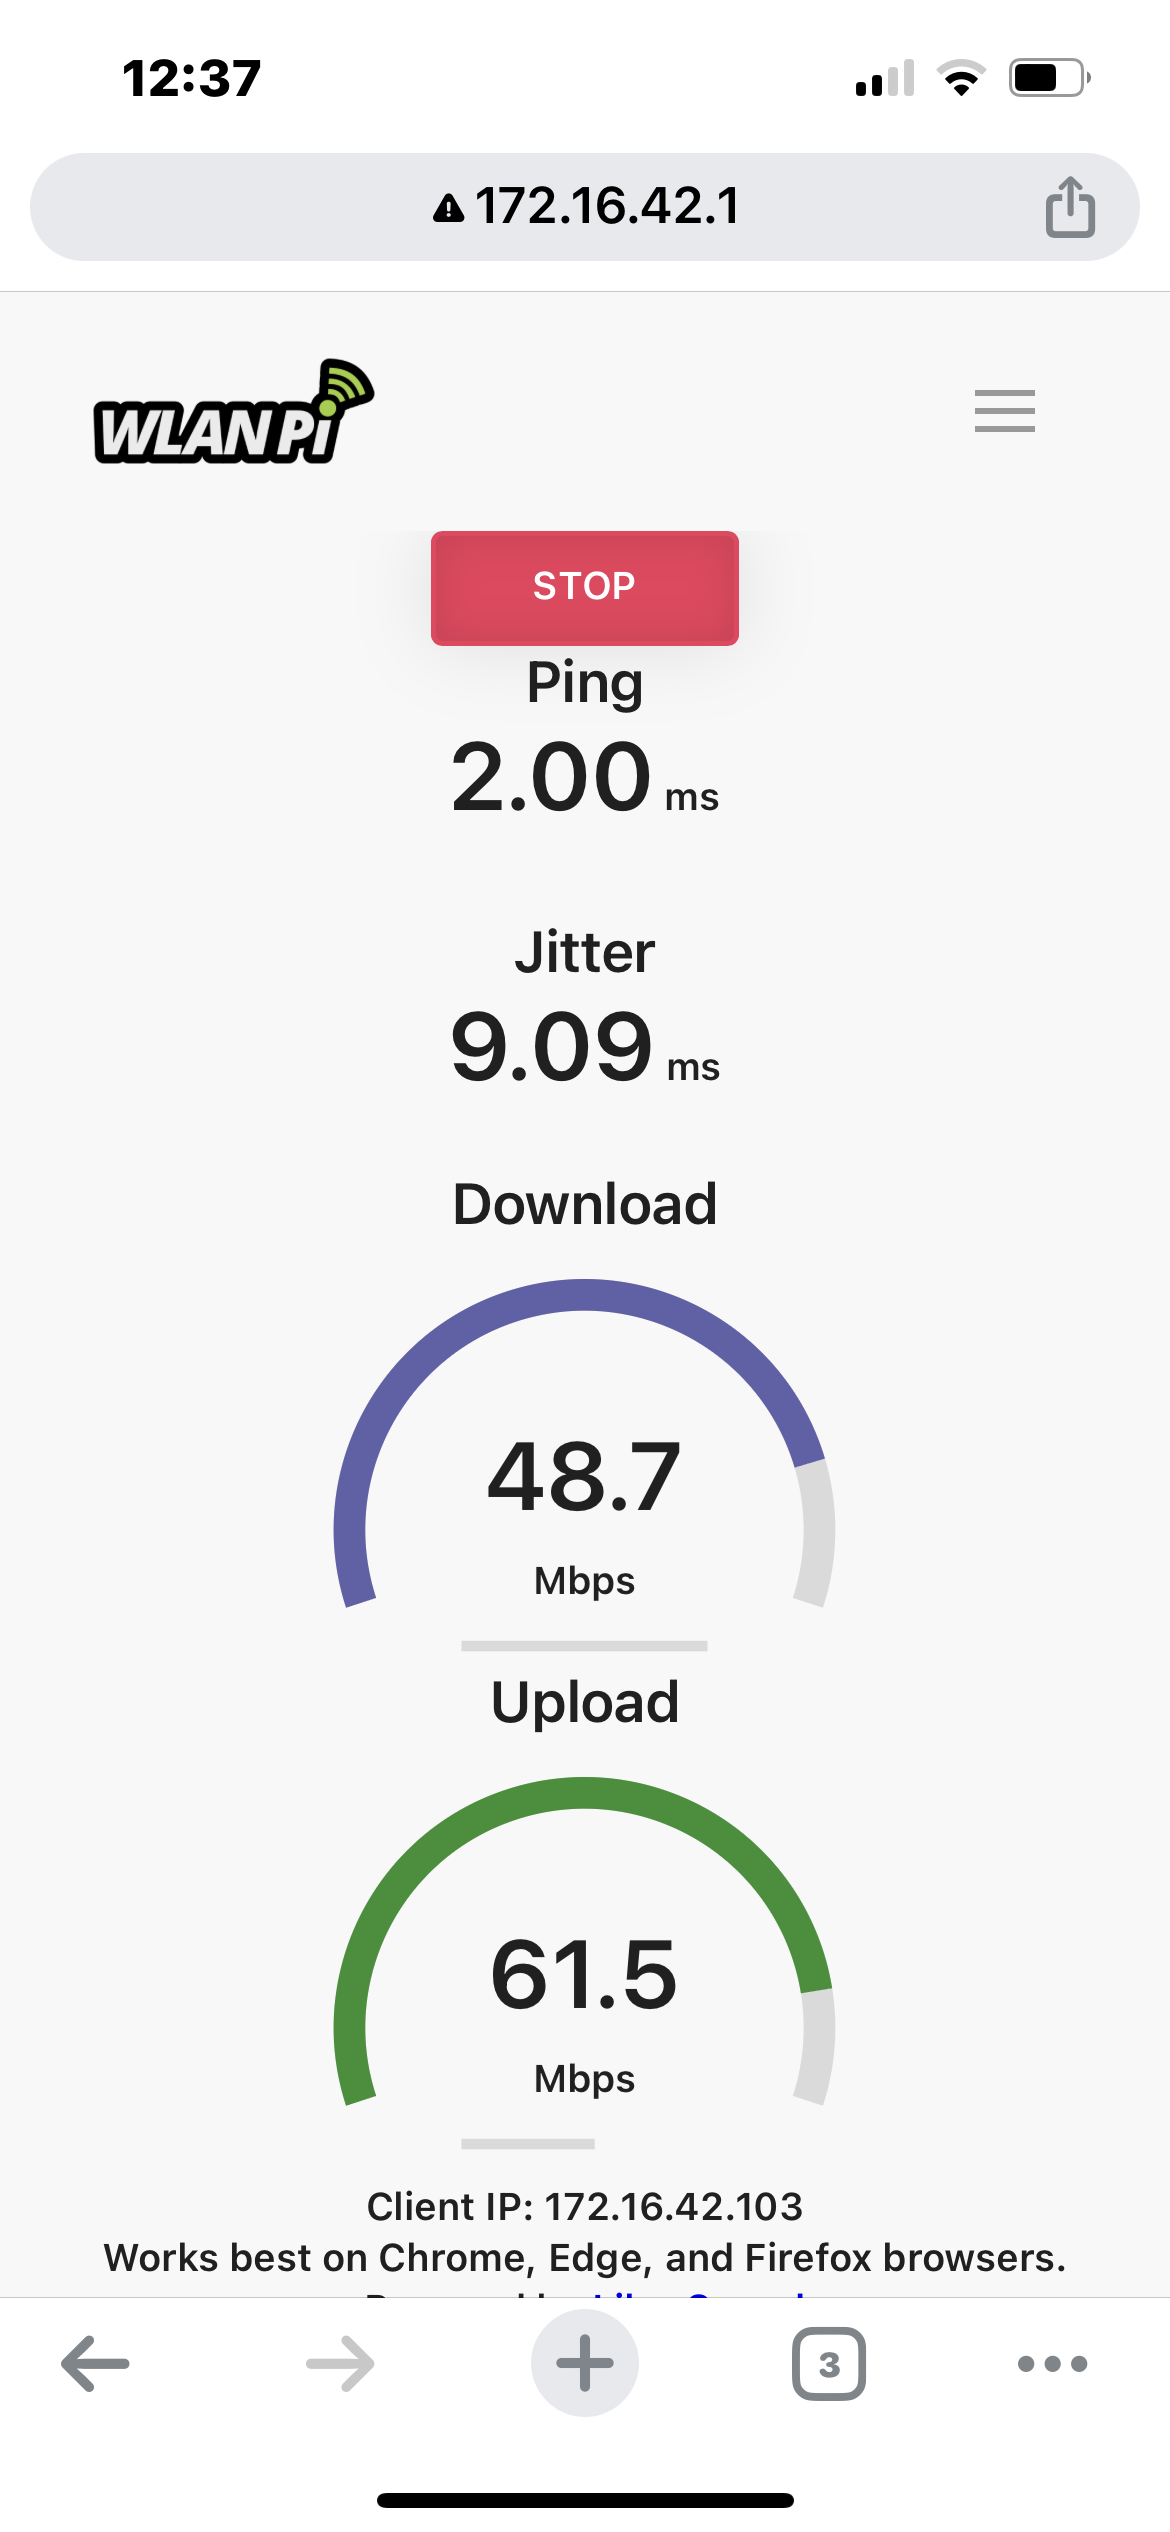
Throughput Metrics
The following tests were performed at different locations on the field, and within what would be considered the coverage area for the radio profile applied, which in this instance is set to Narrow (Boresight) on both Slots.
These tests use iPerf built into the WLANPi, and the iPhone is not connected to a public internet connection.

Conclusions
As expected, when moving further away from the AP and given direct line of sight, throughput values are impacted, however it is interesting to note that between 50m and 100m out from the AP these values are almost identical, thus I can only assume that we are still well within the audible range of both the iPhone, which does have a maximum TX power of 21dBm and the AP, of which one of the radio slots is also operating at the same power.
When referencing the data collected in Ekahau noted above, the RSSI and SNR is still easily within the tolerances required to support the measured throughput.
What I find most interesting though is the delta between download and upload, in that transmit performance is consistently between in all tests, I can surmise that this is a direct result of the receive sensitivity of the AP itself being able to recover more signals from the associated STA and achieve a higher MCS rate. I didn’t have the capacity to take a packet capture during these tests, but I hope to repeat this test in the future to try and validate this claim.
The outlying tests that were conducted in the corners of the field were also interesting to see what the audible range of the AP would look like towards the limit of the coverage this particular radio profile to configured for (Narrow Mode) and was pleasing the verify that there is indeed a very sharp drop off in terms of throughput, which certainly gives confidence that this AP could be used in high density applications where many C9104 APs need to be deployed in closer proximity.
Hope that this is useful and informative, it has certainly given me a great deal of insight into the capabilities of this product and renewed confidence to deploy it as part of a very high density LPV installation.