Introduction
Tiered seating, or bleachers as they are referred too in the US are a common sight in large public venues (LPV) and arenas, as they maximise the total floor area whilst allowing all visitors un-obstructed views of the main floor/performance area, typically constructed of pre-cast concrete, they provide a firm footing on which seating and handrails can be installed. The angle or pitch of seating often increases proportional to the height of the venue.
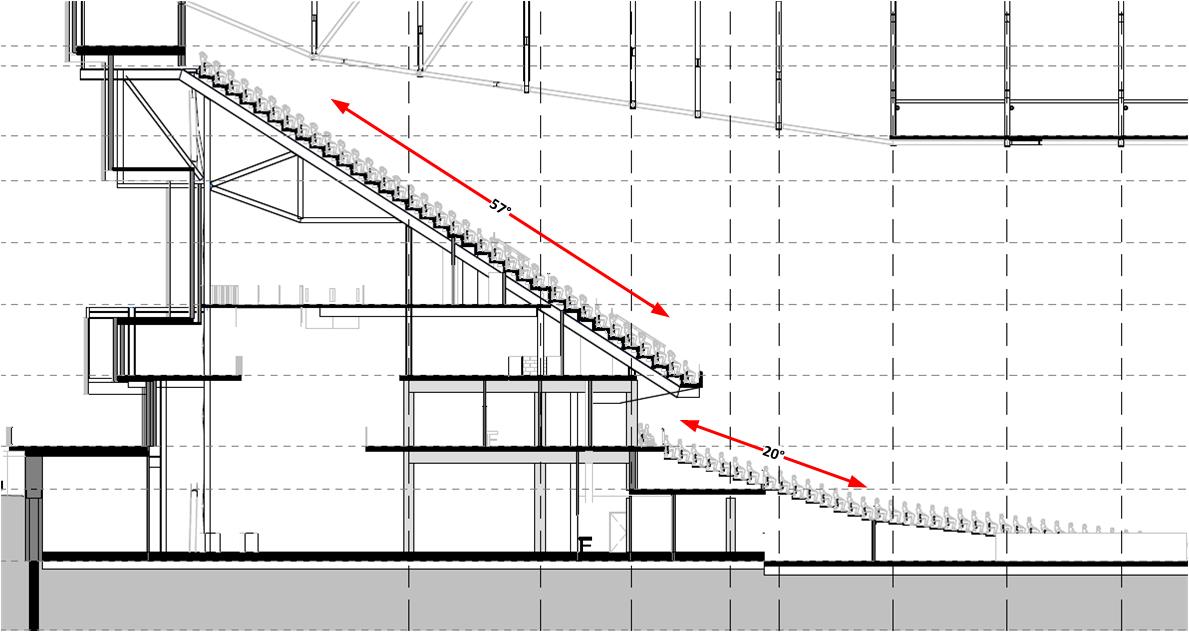
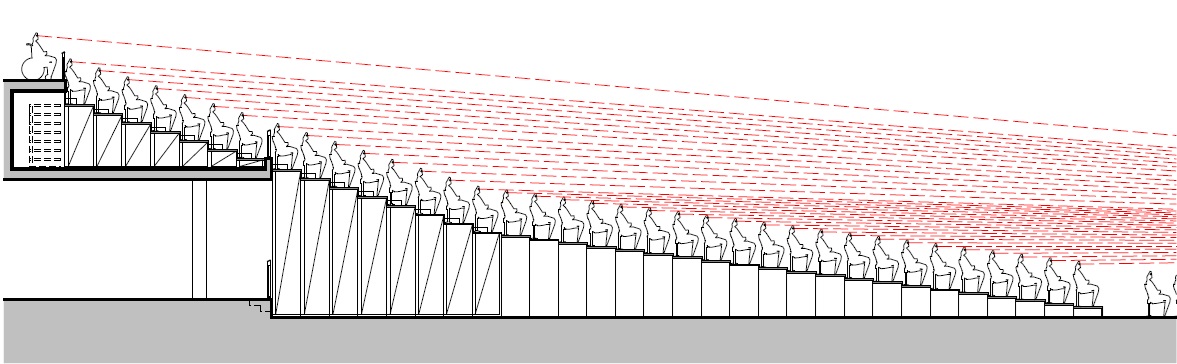
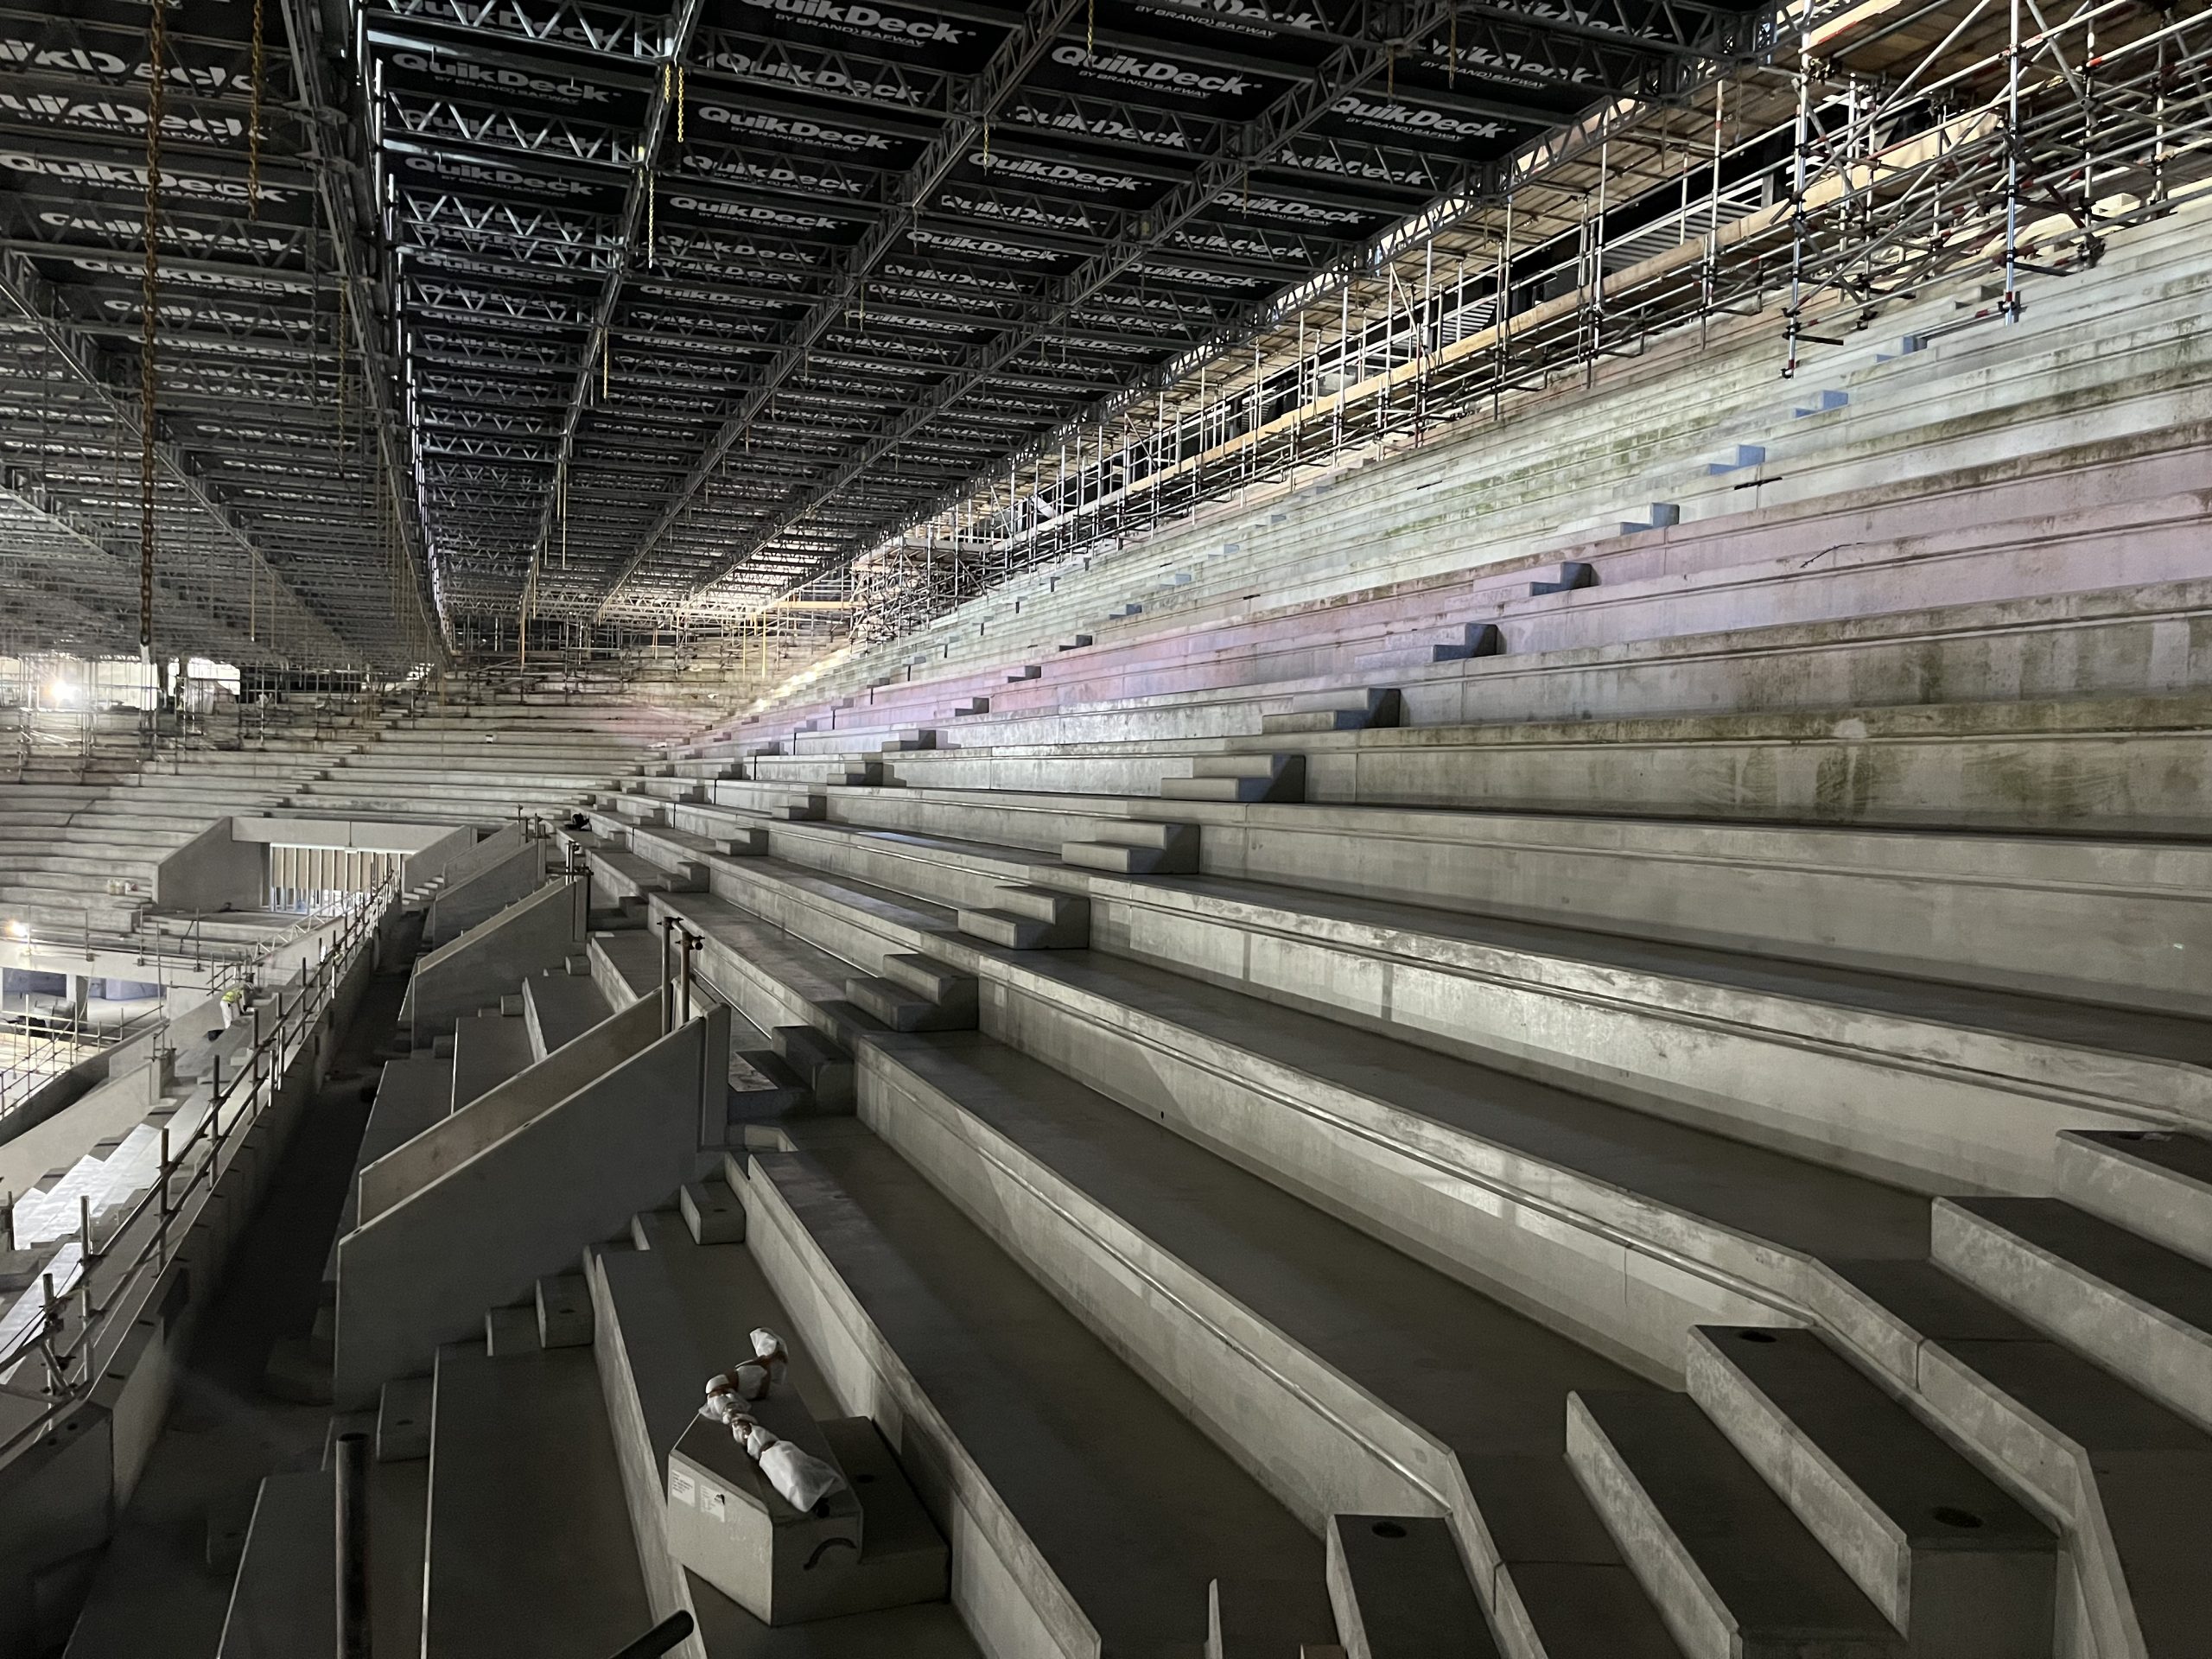
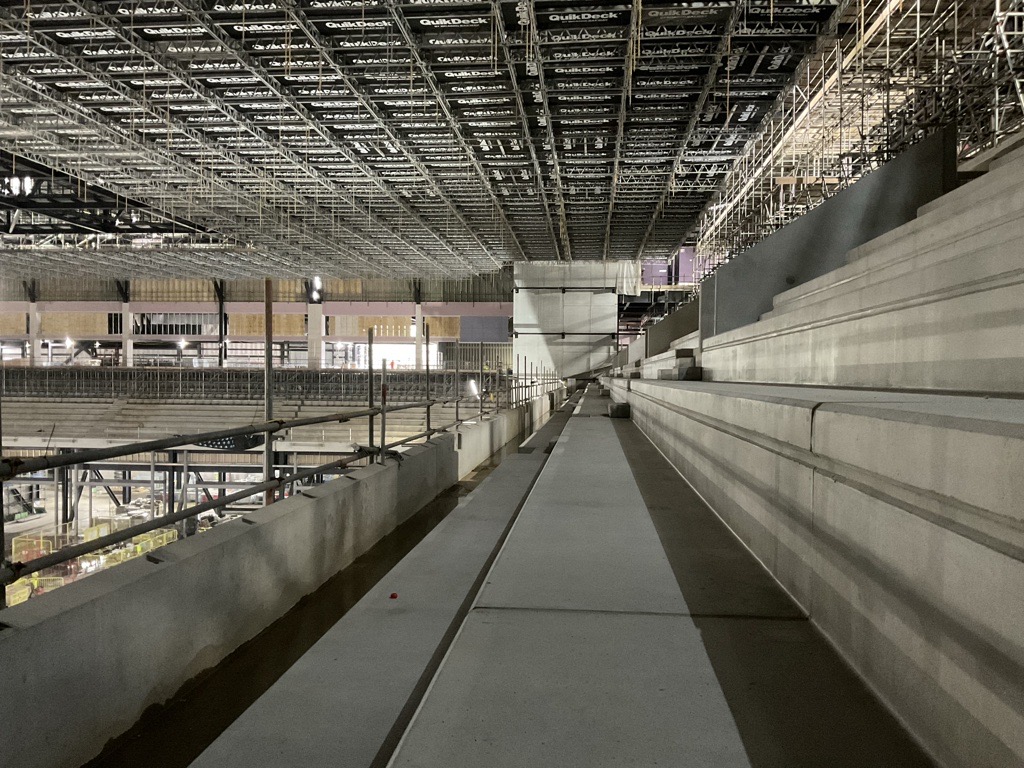
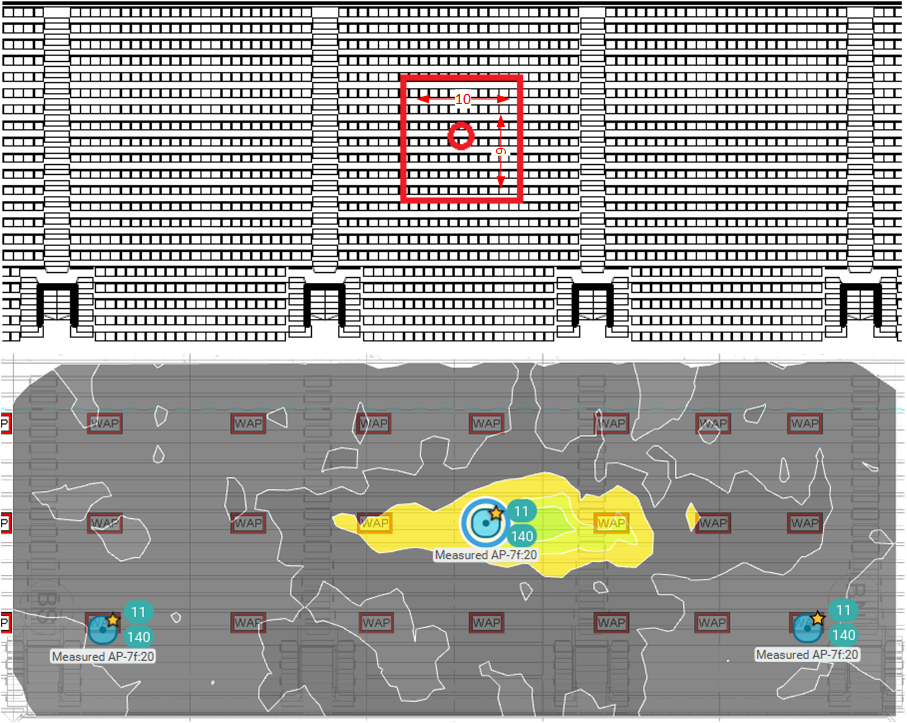
Before seating is installed, it is clear to see how this is represented within the venue and an idea of the change in pitch/elevation between each seating tier.
Proximate Wireless Designs
One of the common approaches for deploying a high-density wireless network in this scenario is to place access points (APs) under the seating and within an IP-rated enclosures, although there are now excellent products available in the market to achieve similar results using an overhead approach at much reduced cost.
I previously did a technical review of a number of different types of enclosures from different vendors to determine which would be the best suited for this particular application and one that met the aesthetic requirements of the operator.
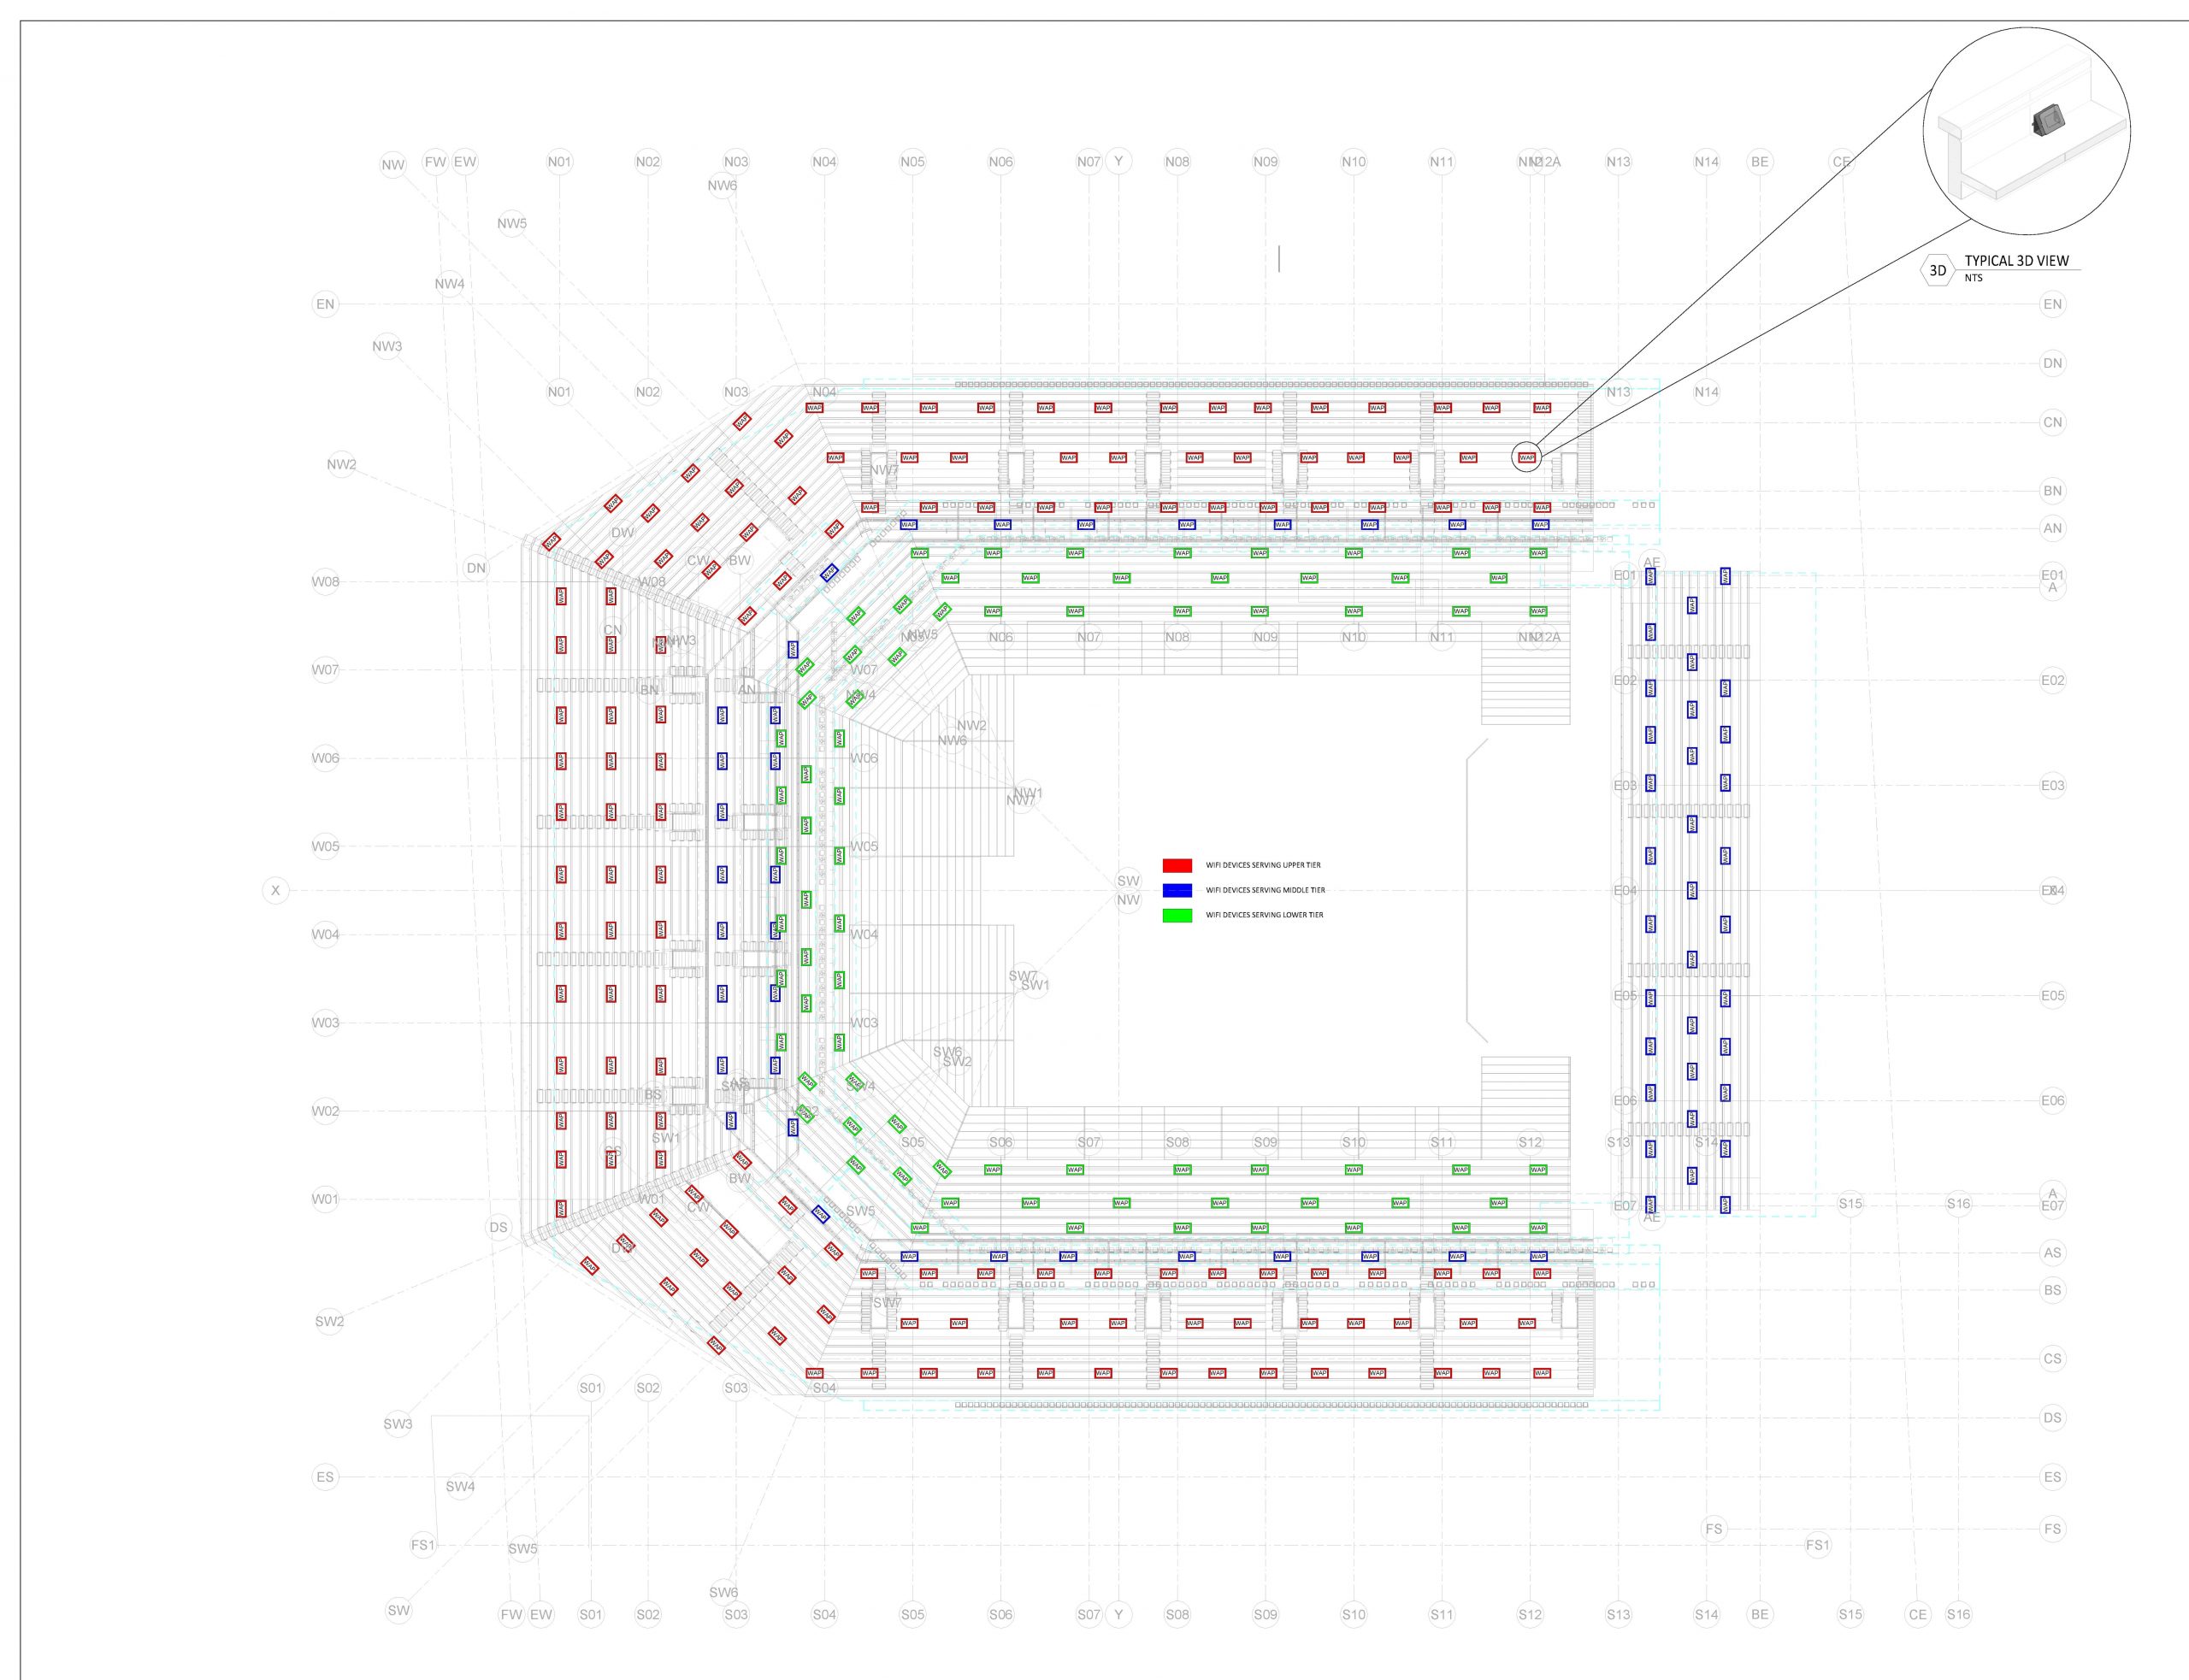
The original layout of the bowl as part of this deployment is below, in total it was proposed that 298 Cisco Catalyst 9120AXI APs would be installed into Oberon 1020-00-USM30 enclosures. These would be fixed in place at the location shown, cores drilled and passive cabling run to each position, with the intention to use a static power and channel plan, which would be validated post-install.
There are both positives and negatives to this approach, the latter principally being is that it is very expensive, and only performs well under high capacity ie: the majority of seats occupied to increase the overall attenuation of the wireless system and improve channel re-use, there are a number of articles have been written on the different approaches to LPV design over the years, and opinion varies. But these designs do work and have been a deciding factor for pushing peak data volumes at live events to record levels, a great article on this was published on Stadium Tech report in 2022 and a recent update following Super Bowl LVIII.
If you want to observe the impact that crowd density has in terms of performance for a proximate-based design, I highly recommend you watch the high-density presentation at Cisco Live by Josh Suhr and Matt Swartz two of the best engineers in the high-density game, this is also one of the best presentations you can watch, especially if this is a chosen area of interest.
High-Density Wi-Fi Design, Deployment, and Optimization – BRKEWN-2087
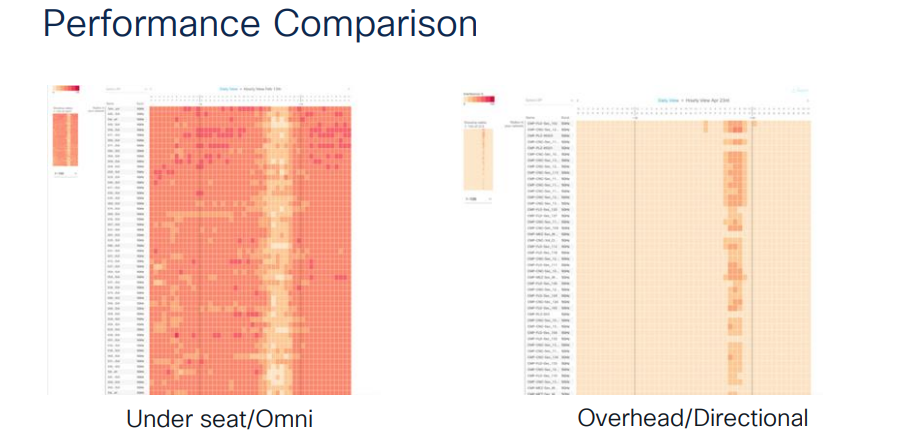
Essentially what this image below represents is co-channel contention over time, the darker areas are where interference was very high, due to low occupancy, and only improved during the event when all seats were occupied, thus increasing overall RF attenuation, and as a direct result an increase in capacity, this period is noted by the lighted coloured areas.
Outside of this period total system performance would likely have been inhibited as co-channel contention would be extreamly high.
Pre-Deployment Validation
Validation is an important part of the wireless design and implementation lifecycle, although given the capabilities of the planning tools we now have at our disposal from the likes of Ekahau, Hamina, iBwave, NetAlly and Sidos, to name a few, the necessity to conduct a pre-deployment survey or AP on a stick, APoS for short is becoming less of a requirement, depending on the physical environment and intended use cases. This process is time-consuming and doesn’t add significant additional value to the customer unless there are unique constraints to the design that cannot be accounted for within our chosen toolset.
LPV is different and is a commonly held belief amongst wireless engineers that I have spoken to on the topic that pre-deployment validation of these environments is essential.
Disclaimer: Due to circumstances beyond my control, this work was not fully completed, as this design was later waivered in favour of an overhead approach, which I will gladly talk about in the future, but for now wanted to share what I had learnt in hope it will benefit others undertaking the same approach.
Methodology
The physical structure within a stadium or arena is often repeated throughout the venue, and as a result, not all areas need to be validated, providing that the dimensions and materials used in the construction of the building is replicated throughout, this, however, is not an assumption, and seek to qualify this by cross-referencing real-world data vs a building information model (BIM) and consultation with the principal contractor.
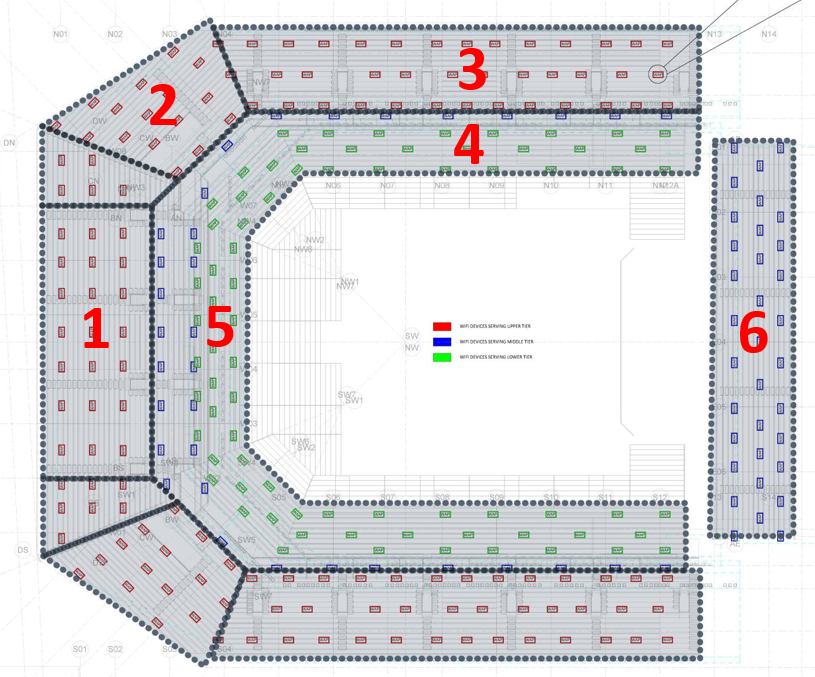
In the case of this arena, 6 areas were selected (1-6) for the APoS survey where under-seat APs would be installed. Essentially, if you draw a line East to West through the venue, it is clear to see that the seating sections are mirrored North to South and thus repeating the validation exercise was not deemed necessary in this instance.
The intention was not to conduct an APoS survey of every position, but to get a better understanding of RF propagation in the immediate vicinity of where the AP was positioned, especially above/below the specific tier on which is was installed, bearing in mind that seating is still to be installed, and people to actually occupy the venue, as such data recorded at this stage would likely be more favourable as opposed to during normal use.
This process was further complicated with the addition of a QuikDeck which was erected during construction to provide a temporary work area below the main arena gantry, suspended 25m from ground level, whilst this doesn’t inhibit the process of conducting the APoS survey within the tiers, I strongly suspected that due to the proximity of this platform to the upper tiers, there was a higher percentage of multipath present in the environment which may have skewed the results slightly.
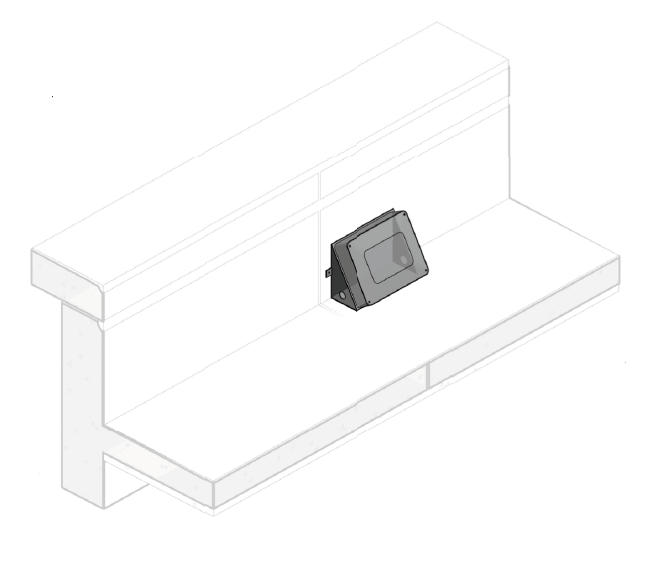
The main obstacle that I felt needed to be addressed was how to position the access point, the enclosure that was selected placed the AP on a 30° angle, thus in my opinion, a lot of the RF energy would be directed inwards, towards the bowl, and due to the pronounced step between the seating tiers, considering this is constructed of reinforced concrete, it would likely add significant attenuation resulting in limited coverage.
Design Requirements / Specification
The most important step in any design is to first understand the customer requirements, in this instance, it was mandated by the client and associated mechanical electrical (ME) contractor that we work to the following specifications. This is the blueprint, not just for the RF design, but for the building as a whole, the challenges this can cause a separate discussion in itself, as often there are requirements imposed on contractors that could be considered detrimental to system performance, and are often hard to influence, even at the preliminary design stage.
Also remember, that not all requirements are good requirements and red flags should be raised as a matter of principle. The specification is treated like gospel at the building sign off and failure to meet these requirements can result in penalties.
- The network shall be designed based on a minimum signal level of -65dBm – Although not strictly defining what device would be used to measure this.
- The system shall support having no more than 75 users per access point, in-bowl shall be 50-60 users per access point. This will facilitate the base requirement of having 100% of the users in the facility connected at any given time.
- Each user shall be able to receive a minimum of 20 Mbps of up and down bandwidth simultaneously to every other connected user.
- The design of the Wireless Network should minimise the number of SSID’s.
- No handrail placements of Wireless Access Points are permitted on this project. All in-bowl wireless access points shall be under seat.
What did I say about not all requirements are good requirements? The inclusion of the statement that the wireless system needed to provide 20Mbps of bandwidth per user @ 100% take rate (23,500) raised a few eyebrows immediately, which when queried with the consultants who wrote the original specification was quickly revised to a more realistic figure of 2Mbps per user and 30% take rate. This is still a chunky number but those who have ever tried to simulate capacity within a planning tool will realise, it is extremely rare that you would expect all users to be contending a transmit opportunity (TxOp) at exactly the same time and client airtime utilisation is wholly un-predictable.
For anyone interested in studying the approach for dimensioning of high-density wireless networks I honestly cannot recommend the following guides enough, put together by Chuck Lukaszewski, CWNE #112 at Aruba – now retired, and whilst they are a little behind current technology, they are still a goldmine of information.
Aruba – Very High-Density 802.11ac Networks Validated Reference Design
APoS Setup
As I would consider standard practice, before conducting the APoS survey, a predictive design was completed within Ekahau, due to the timing, this design was completed long before the shell and core of the building was erected and thus only architectural plans were available, CGI and BIM models are also extremely useful at this stage, and coordination with the building architect to get access to these plans, or spend time reviewing them with an engineer is vital, to understand not just the building composition, but also identify physical constraints and start to derive strategies for AP mounting.
For the APoS survey itself, my first focus was to identify what the impact of the seating angle would have in terms of RF attenuation for the seating area directly adjacent to where the AP was situated, especially on the upper and lower tiers, as in the predictive model an AP had not been placed within every seating isle.
For this, 3 positions were selected and the APoS setup was configured as follows:
- Cisco Catalyst 9120 AXI AP in EWC Mode – v17.6.5.
- Accelerator Site Survey Battery Pack V2.
- Oberon – 1020-00-USM30 Enclosure.
- To replicate how AP would be installed to the final position, it was installed into the enclosure as it would be placed under a seat, with the lid installed.
- 5GHz Only.
- Static Channel and TX Power – CH140 @ 10dBm.
- Ekahau Sidekick v1 – Firmware v2.5.53.
- Apple iPad Pro – iOS v15.7.
- Ekahau Survey for iPad – v2.0.2.
The following methodology for conducting the survey was:
- Place the APoS AP at 3 pre-determined locations as defined as part of the predictive design.
- Conduct a “Continuous” survey of every seating aisle, in both directions along each seating tier to account for attenuation loss attributed to the sidekick being worn at the waist.
- In this particular instance, it was decided not to survey until a specific maximum RSSI threshold was reached.
- Once the full survey path had been completed, the AP position was “Frozen” within Ekahau Survey and the AP moved to a new position.
- The sequence was then repeated using the same walking path for each new AP position.
Once each position has been validated and AP’s frozen at their respective location, the walking paths are recorded on the floor plan. Nb: That the channel and AP radio MAC address, derived from the BSSID are identical.
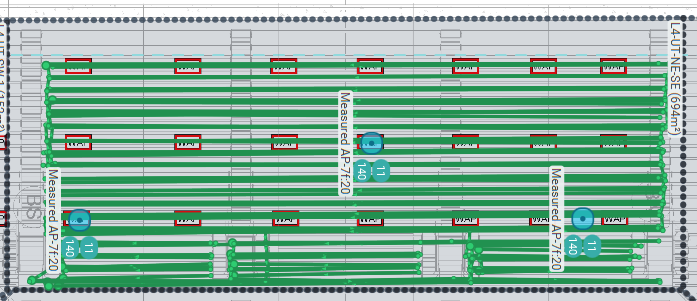
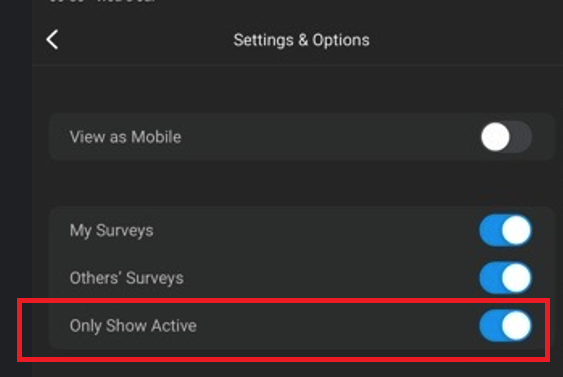
One thing to note is that when doing this type of survey, the screen can get very busy, quite quickly and hard to determine the walking path being used as part of the active survey, this behaviour can be modified within the app to only show the survey path of the active survey, which makes the screen much less cluttered, I do tend to turn this off when doing passive/validation surveys of buildings, as in that instance it is important to track which areas have already been surveyed.
APoS Results
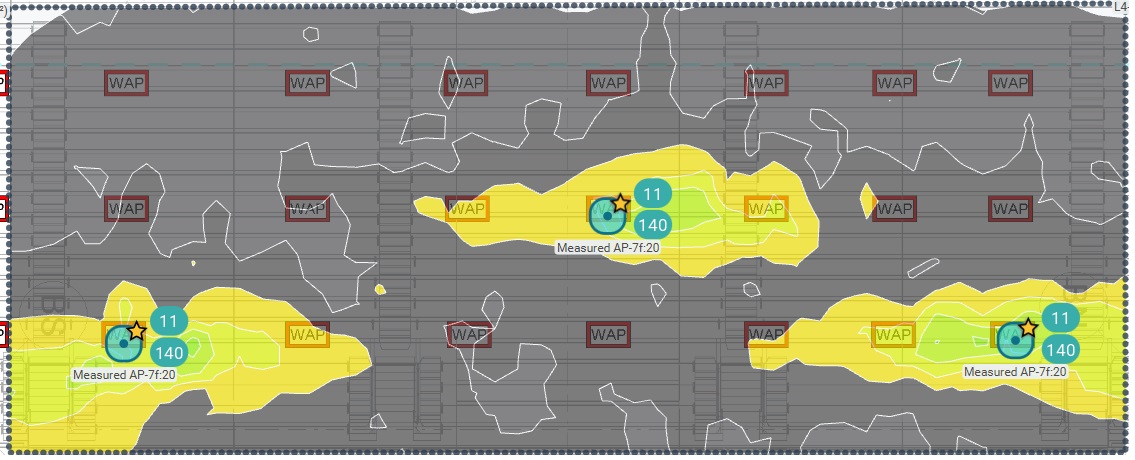
Although due to the extenuating factors identified previously, the results derived from the survey indicated that my initial concerns regarding attenuation were justified, and concerning given that this survey was conducted without fixed seating installed, and unoccupied, which would further add to the attenuation factor.
With that said though, the intention as part of the proximate design is to limit the effective audible range of each AP, reduce CCI and increase the available capacity of the system, which, if we take into account all potential AP positions, is very likely to be achieved with the current variables in mind, especially given the density of APs that were proposed to be installed within the bowl.
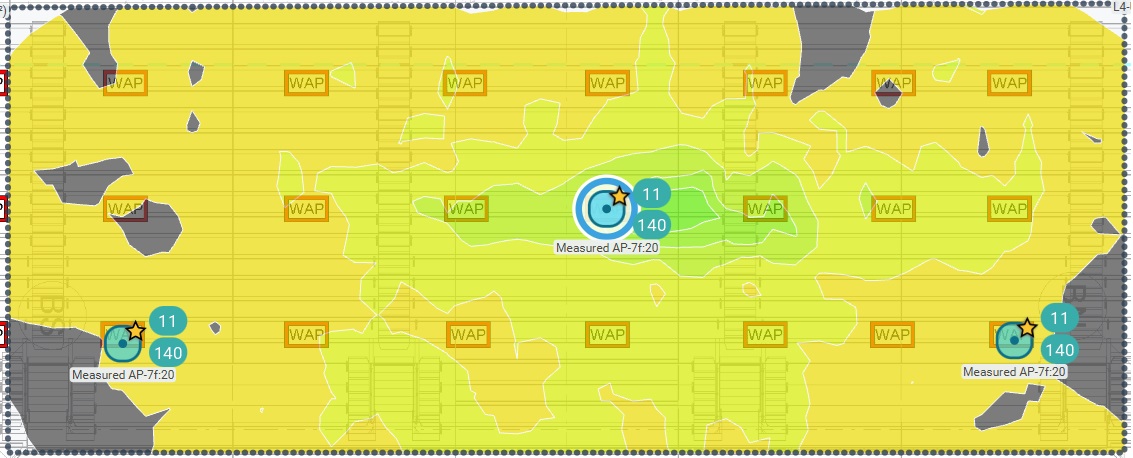
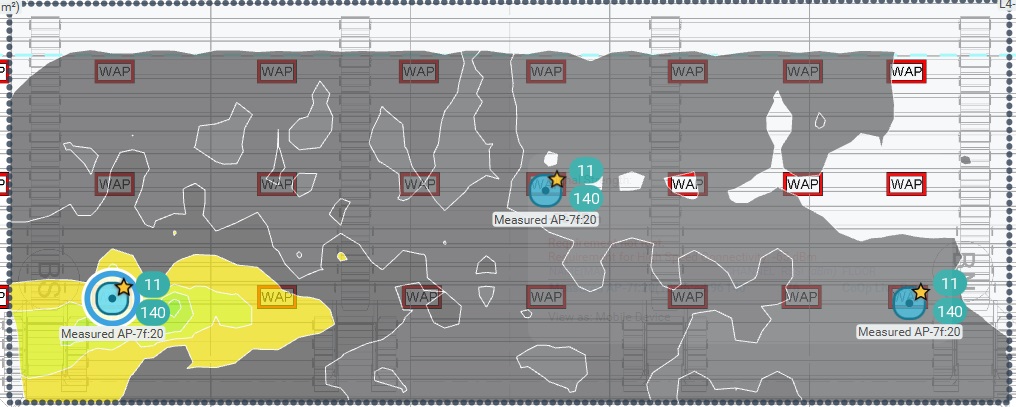
In all instances, the signal threshold was set to -65dBm.
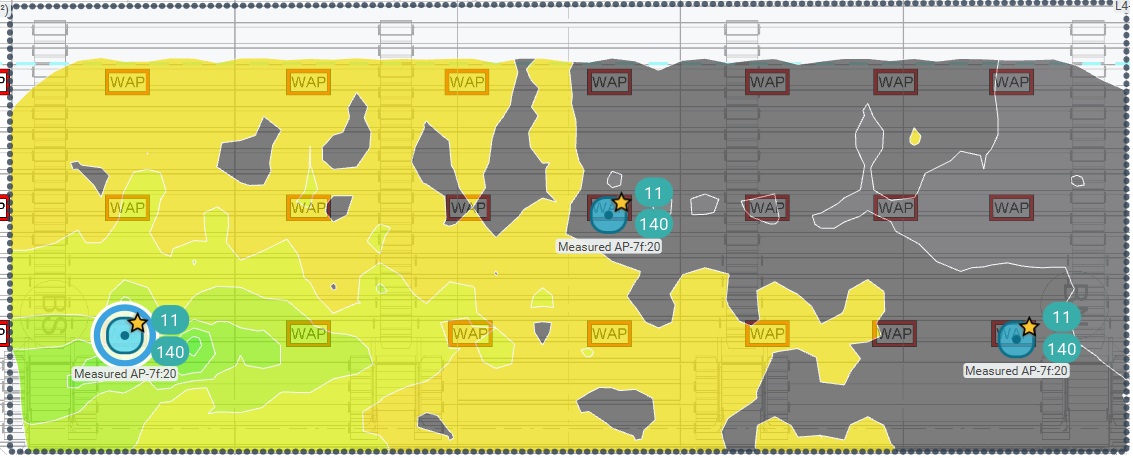
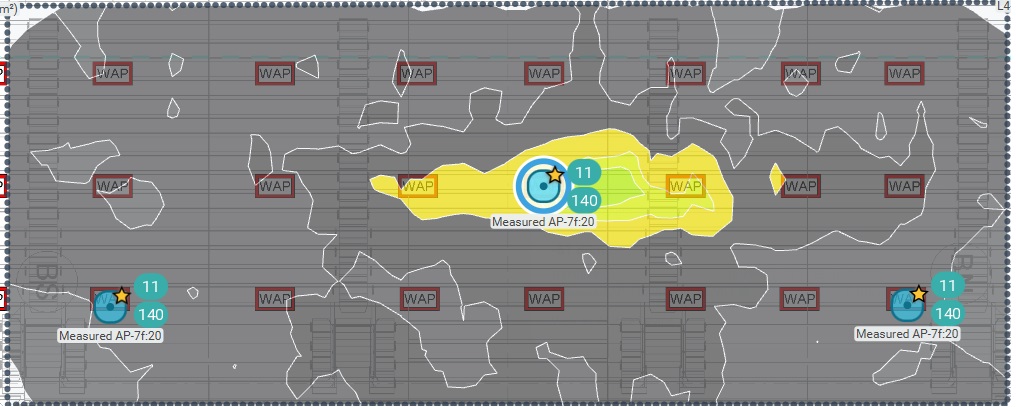
It was interesting to also note that the angle of the seating, from the viewpoint of the APs installed on the lower section, does have an impact on attenuation towards the upper tiers, and whilst we would not expect to service these areas from the AP positions noted, it may ultimately help with channel re-use, when not taking into account other factors such as the use of RxSOP, repeating channel plans or adjusting TxPower.
Summary
In summary, whilst it wasn’t possible to take this further, it was still a valuable exercise to validate RF signal propagation against the predictive design and draw a line under the concern as to whether the proposed placement of APs would impair system performance, at the user density required in the specification (50-60 clients) per AP/Radio.
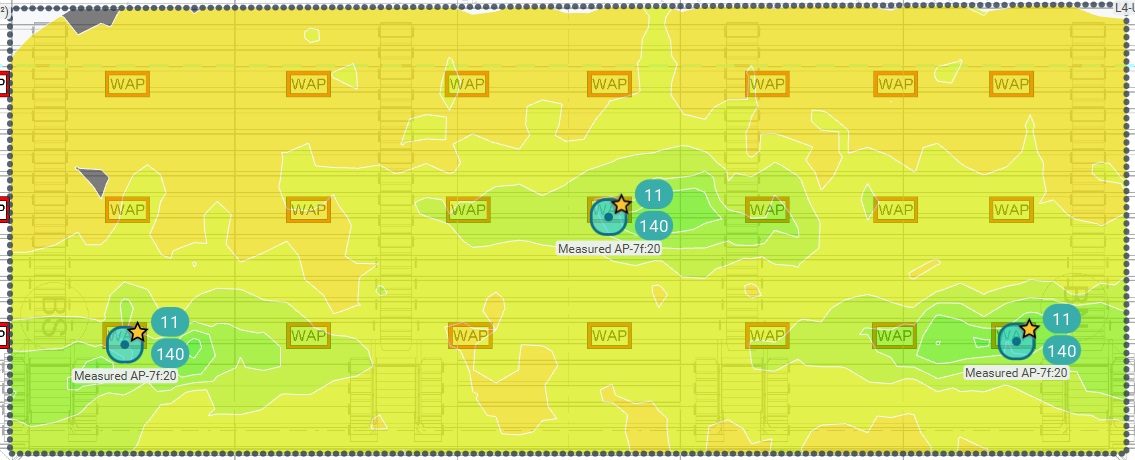
Which, if we look at a worst-case scenario with an offset of 10dB applied, would seem to be on par with the number of seats within the given area that would want to service from a single AP.
This is by no means an exact science and would require further study, and validation with actual client devices to determine whether the requirements are being met, once the physical works are fully completed.
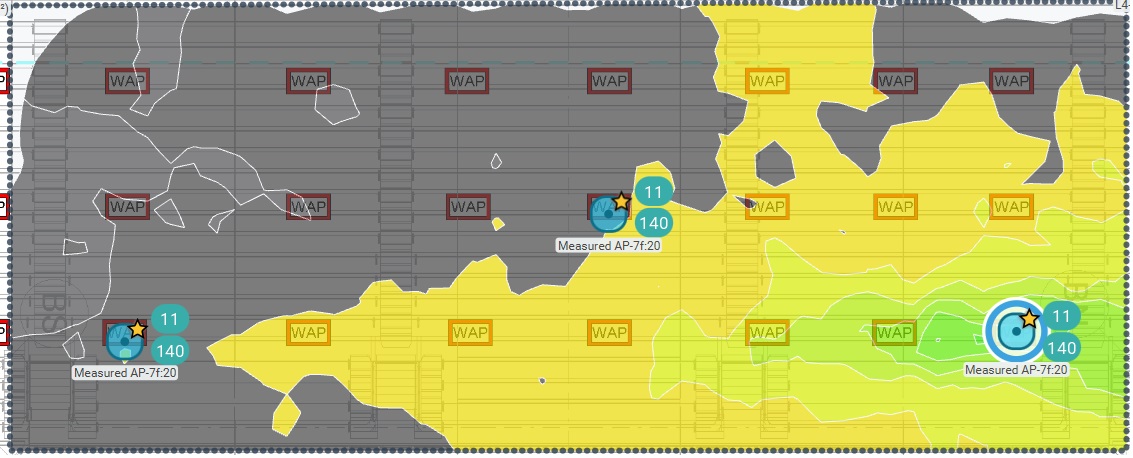
What is clear is that coverage is much better laterally from each AP location and more impaired directly above/below each location, due to the physical construction of the tiers, even with the AP placed on an angle of 30° within the enclosure.
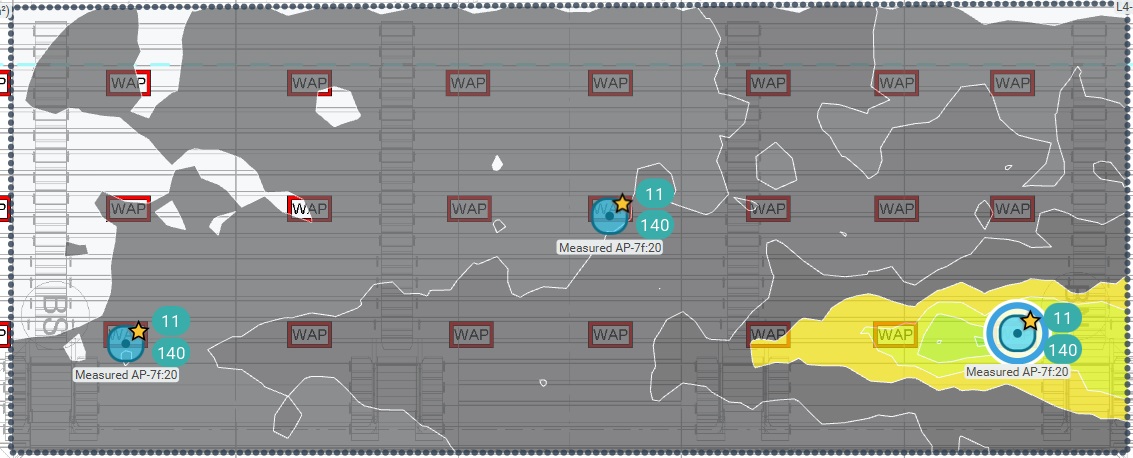
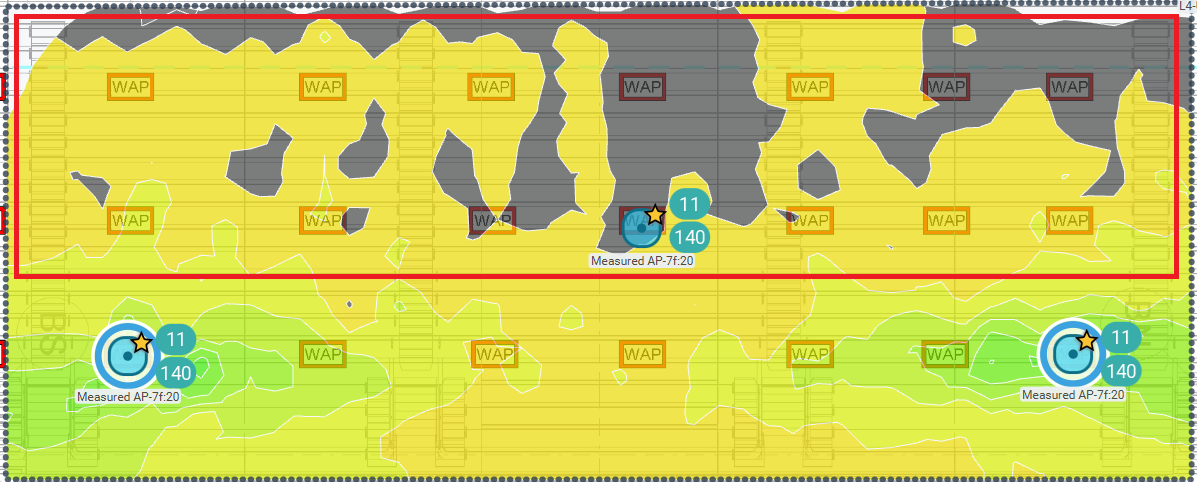
If we cross referance the measured data, with the predictive design, and the same offset applied we can start to see a similar pattern emerging. The key difference howerver is that within the predictive design, we have an attentuation area set to mimic a human crowd (3dB/m) and we can’t account for the changes in pitch/elevation, a feature which would be incredibly useful, the visualization assumes the AP is placed free of other attenutating surfaces and a uniform radiated pattern is produced, with the required threshold set at -65dBm in all scenarios.
I would very much have liked to repeat this test with seating installed, and also occupied, perhaps next time. But it’s obvious that a full APoS validation of the bowl would be an incredibly time consuming process, further attributing to the increased costs associated with this type of design.
Hope that this is useful and informative, it has certainly given me further insight, If someone has access to data from a similar scenario to show the impact of an empty vs seated environment I would love to see it!